


Technical Report 40: Device-Collected Physiologic Data in VA Research
Suggested CitationGraham LA, Wagner TH, Illarmo S, Harris AHS. Device-Collected Physiologic Data in VA Research. Technical Report 40. Health Economics Resource Center, VA Palo Alto Health Care System, U.S. Department of Veterans Affairs. October 2022.
For a list of VA acronyms, please visit the VA acronym checker on the VA intranet at http://vaww.va.gov/Acronyms/fulllist.cfm.
Highlights
- The VA Corporate Data Warehouse (CDW) Vital Signs domain only includes physiologic data collected in a ward or clinic setting.
- Device-collected vital signs from intensive care units (ICUs) and post-anesthesia care units (PACU) occur more frequently and are significantly different from those found in the CDW Vital Signs domain.
- These differences may lead to information bias in VA studies that use CDW Vital Sign domain data.
1. Introduction
The VA Corporate Data Warehouse (CDW) Vital Signs domain is the standard location for obtaining most VA physiologic data such as blood pressure and heart rate measurements. However, one important and often overlooked limitation of the CDW Vital Signs domain is that the data represent only physiologic data elements that were read and recorded by nursing staff in a ward or clinic setting at a predetermined interval across an inpatient stay, usually every 4-6 hours (Kamio, et al., 2018). CDW Vital Signs data do not include the massive quantity of physiologic data available from patient monitors that are becoming more frequently used throughout the hospital.
Other locations like operating rooms (OR), intensive care units (ICU), or post-anesthesia care units (PACU) have patients that are under more intensive monitoring, resulting in a large quantity of data that are not readily accessible to VA researchers yet still used in clinical decision-making. As Patterson et al. reported in 2012, 44 VA ICUs and 7 VA acute medical care wards were missing vital sign assessments for more than 20% of patient days (Patterson et al, 2015). Our preliminary analyses using more recent data have echoed these findings. Among a group of surgical inpatients in ICUs, we found that only 37.5% have at least one vital sign recorded in the CDW during their ICU stay.
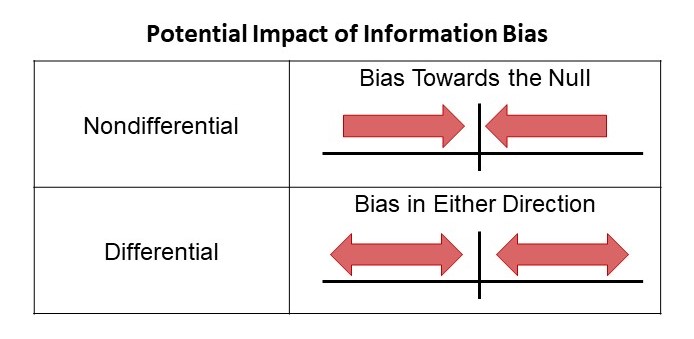
Device-collected data from patient monitors are available and interpreted by healthcare staff but are rarely included in VA research studies because they are not available in a national data repository. Their omission could introduce information bias to research results. Information bias is a form of bias resulting in the misclassification of the study subjects in terms of either exposure or outcome status (Rothman, et al., 2008). Of course, some forms of device-collected data could be relatively uninformative and lead to nondifferential misclassification of exposure of outcome status. However, it is also possible that the missing data are informative and thus lead to differential misclassification of exposure or outcome status when used in VA research studies.
Thus, the goals of this technical report are as follows
- Quantify differences between device-collected physiologic data and data obtained from the CDW Vital Signs domain for a cohort of surgical patients
- Discuss the potential impact of these “missing” data on analyses using physiologic data
2. Methods
This technical report includes data for all inpatients undergoing a surgical procedure in an OR at one of six VA Medical Centers in VISN 21 between January 1, 2020, and December 31, 2020 (1 year). The Stanford Institutional Review Board reviewed and approved this study with a waiver of informed consent.
Patients were identified in the VISN-level Picis Clinical Information Suite data managed by Bitscopic, inc. Picis Clinical Information Suite is a platform that all VISN 21 facilities use to store device-collected data for Veterans visiting an OR, PACU, or ICU. Only patients with at least one OR encounter and a length of stay greater than 24 hours were included. For simplicities sake, we limited our analyses to five commonly reported postoperative vital signs - systolic blood pressure (SBP), heart rate (HR), respiratory rate (RR), oxygen saturation (O2), and temperature (F). These vital signs were queried from both the Picis Clinical Information Suite data and the CDW Vital Signs domain. Intraoperative vital signs from the index OR encounter were not included. Minimal data cleaning was performed using the following parameters with upper limits equal to the 99.5th percentile of the distribution:
- SBP <0 or >250 mmHg
- Heart Rate <0 or > 200 beats per minute
- Oxygen Saturation <0 or >100%
- Respiratory Rate <0 or >50 breaths per minute
- Temperature <0F or >120F
Additional patient and procedure characteristics were collected from the CDW.
3. Results
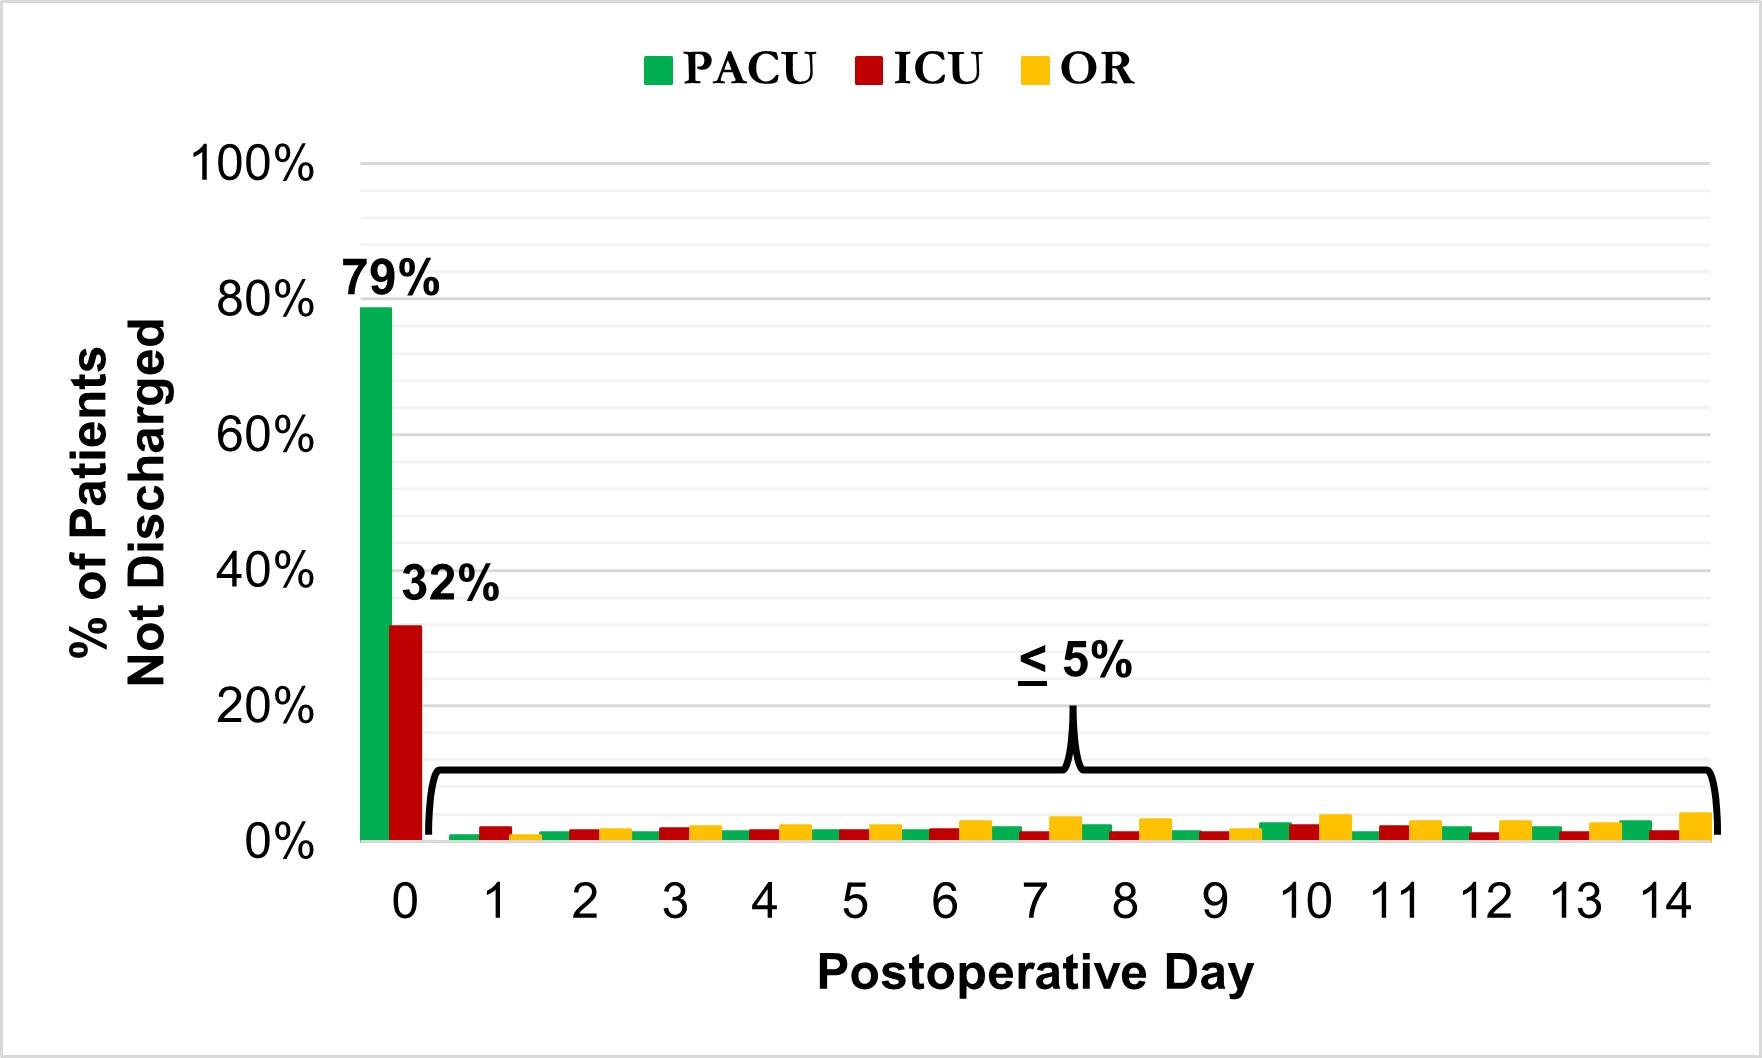
We identified 3,092 inpatient operative procedures among 2,765 unique patients. The average length of stay was 7.3 days (Median=4 days), with a postoperative length of stay averaging 5.5 days (Median=3 days). 80.1% of patients had at least 1 PACU visit (n=2,477), 34.3% of patients had at least 1 ICU visit (n=1,061), and 8.1% returned to the OR after their index operation (n=249). Patients spent an average of 6.1 hours (median = 1.9 hours) in the PACU and 131.7 hours (median = 50.5 hours) in the ICU. Most ICU and PACU visits occurred within 24 hours of the index operation (Figure 1).
Figure 1. Proportion of Patients Visiting an ICU, PACU, or Returning to the OR for Each Postoperative Day
There was no evidence of duplicated or overlapping assessments between the two data sources – CDW and Picis. Of the very few assessments documented at the same time in both data sources (n=4,665, 0.03%) none had equal values (p=0.03). The final analytic file included 15,584,087 unique assessments, the majority of which were HR (40.1%) or O2 (37.7%) values (Table 1).
The average time between assessments differed drastically by the data source, CDW vs. Picis. Assessments recorded in the CDW typically occurred every 4 hours. In contrast, most assessments obtained from Picis device-collected data were recorded every 1-2 minutes with the exception of temperature assessments which were recorded once every 22 minutes on average (Table 1).
The number of assessments available in the data also differed drastically by source, CDW vs. Picis. Device-collected vital signs from Picis represented 97.2% of all postoperative SBP, 98.8% of postoperative HR values, 98.8% of postoperative O2 values, 86.8% of postoperative RR values, and 69.0% of postoperative temperature values (Table 1).
| Frequency | Timing | Values | ||||||
| N | (%) | Mean (SD) min. between assessments | Mean | (SD) | Median | (IQR) | ||
| Patients | 2,765 | |||||||
| Admissions | 3,092 | |||||||
| Systolic Blood Pressure (mmHg) | CDW | 76,550 | (2.8%) | 239.2 (208.5) | 130.30 | (21.5) | 129.0 | (114-145) |
| Picis | 2,634,308 | (97.2%) | 2.2 (27.9) | 123.47 | (25.6) | 121.0 | (106-140) | |
| Heart Rate (beats per min.) | CDW | 77,173 | (1.2%) | 237.4 (208.2) | 79.07 | (15.0) | 78.0 | (68-89) |
| Picis | 6,173,035 | (98.8%) | 0.95 (17.2) | 81.94 | (18.4) | 80.0 | (68-94) | |
| Oxygen Saturation (%) | CDW | 71,156 | (1.2%) | 248.6 (207.5) | 95.98 | (2.9) | 96.0 | (94-98) |
| Picis | 5,794,941 | (98.8%) | 1.0 (17.8) | 96.30 | (3.5) | 97.0 | (95-99) | |
| Respiratory Rate (breaths per min.) | CDW | 69,951 | (13.2%) | 262.4 (216.1) | 17.85 | (1.6) | 18.0 | (17-18) |
| Picis | 459,588 | (86.8%) | 1.4 (22.9) | 14.82 | (9.0) | 15.0 | (7-21) | |
| Temperature (Fahrenheit) | CDW | 69,823 | (31.0%) | 262.5 (213.4) | 98.12 | (0.7) | 98.1 | (97-99) |
| Picis | 155,353 | (69.0%) | 22.2 (112.8) | 97.84 | (1.6) | 97.9 | (97-99) | |
CDW data includes physiologic data recorded by a nurse in a ward or clinic setting.
Picis data includes physiologic data obtained directly from electronic devices in the PACU, ICU, or OR.
In addition, the distribution of values also varied significantly by the data source for SBP, RR, and HR. Values for RR and SBP differed the most by the data source. The average RR recorded in the CDW was 17.8 breaths per minute (bpm) compared to an average of 14.8 bpm for values obtained from Picis, a 17.0% difference. The average SBP using only CDW data was 130.3 mmHg compared to 123.5 mmHg in the Picis data, a 5.2% difference (Table 1).
4. Discussion
Device-collected physiologic data frequently occur after an operative procedure and differ from CDW data in frequency, volume, and value. 98.7% (n=3,053) of our cohort of inpatient surgical procedures had at least some form of Picis device-collected data that was not available in the CDW. Device-collected data average one assessment every 1-2 minutes compared to 1 assessment every 4 hours for CDW vital signs. This results in substantially higher volume data with Picis device-collected data representing 98% of all assessments collected in the postoperative period across both data sources. While most common, device-collected values were clustered in the first 24 hours after surgery (or before death) and became increasingly less frequent as a patient approached discharge. In addition, SBP, RR, and HR values also vary by data source, which may influence research findings. Device-collected SBP and RR values are much lower than CDW-recorded values. At the same time, HR values collected in the Picis device-collected data were slightly higher than those collected from the CDW.
Our findings highlight a significant potential limitation for VA studies that use postoperative physiologic data. Three of our selected vital signs differed significantly by the data source. Thus, not having these data may introduce information bias and affect research findings. Information bias is a systematic error in the definition of the exposure or outcome that results in the misclassification, nondifferential or differential, of the study subjects (Rothman, et al., 2008). It is also referred to as measurement or misclassification bias. In this case, since some vital signs differ across sources, there is the potential for exposure or outcome misclassification in VA research studies that are missing these data. Future studies of surgical patients that include vital signs or other physiologic data should keep this potential limitation in mind when interpreting findings from CDW vital signs alone.
Our findings support prior documentation that PACU and ICU visits following a surgery frequently occur (80% and 34%, respectively), and these assessments are not included in the CDW Vital Signs domain. Further, the omission of these data from VA research studies may affect research findings. However, storing, managing, and analyzing device-collected data can be difficult. As demonstrated by our study, these data are often collected very frequently resulting in large quantities of data that require more storage and greater computer processing capabilities. Because of the amount of data collected, we have found that these vital signs are often captured and stored in different data systems, which vary by VISN and facility. Our study focuses on the Picis Clinical Information Suite, but other clinical software is used across VA. We have found that the Picis Government Suite may be one of the most common. It is used in over 70 VA facilities and 5 entire VISNs.
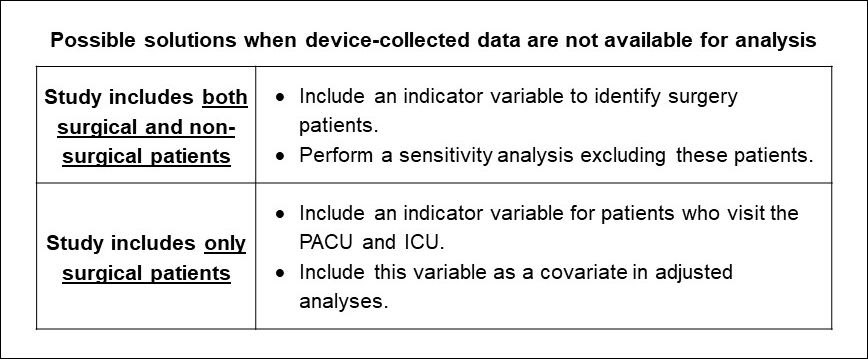
The VA OIT Technical Reference Manual currently lists several other data systems that may also be used to capture and store this data in VA facilities. These include Draeger Medical, Inc. Innovian Non-Clinical Anesthesia Record Keeping Clinical Information System and Switchlane PeriOptimization. Unfortunately, there is currently no national VA standard for capturing and storing this data. For researchers seeking out these data, our study team found that Anesthesia is typically the best initial point of reference for identifying data availability and access within your own facility. Researchers considering studies that will include these data should consider the following possible ways of dealing with their potential omission.
To learn more about how we accessed Picis Clinical Information Suite data for our study, contact Samantha.illarmo@va.gov.
Acknowledgements
This project would not have been possible without the support and insight from the following individuals:
Caroline Gray
Sherry Wren
Mary T. Hawn
Seshadri Mudumbai
James Iannuzi
References
Government Scheduling Software for VA Medical Centers | Picis.
Kamio T, Kajiwara A, Iizuka Y, Shiotsuka J, Sanui M. Frequency of vital sign measurement among intubated patients in the general ward and nurses' attitudes toward vital sign measurement. J Multidiscip Healthc. 2018;11:575-581.
Patterson OV, Jones M, Yao Y, et al. Extraction of Vital Signs from Clinical Notes. Stud Health Technol Inform. 2015;216:1035.
Rothman KJ, Greenland S, Lash TL. Modern Epidemiology. Lippincott Williams & Wilkins; 2008.


