


Technical Report 37: The Effect of the COVID-19 Pandemic on VA Cost and Utilization Data
Suggested CitationWagner TH, Illarmo S, Gehlert E. The Effect of the COVID-19 Pandemic on VA Cost and Utilization Data. Technical Report 37. Health Economics Resource Center, VA Palo Alto Health Care System, U.S. Department of Veterans Affairs. June 2021.
Disclaimers
Many URLs are not live because they are VA intranet-only. Researchers with VA intranet access can access these sites by copying and pasting the URLs into their browser.
For a list of VA acronyms, please visit the VA acronym checker on the VA intranet at http://vaww.va.gov/Acronyms/fulllist.cfm.
1. Introduction
COVID-19 had a profound effect on US hospitals. The American Hospital Association has discussed how the pandemic has created financial insecurity for commercial hospitals. The effect of COVID-19 is also evident in the Department of Veterans Affairs Health Care system, which operates 171 medical centers and 1,112 outpatient clinics across the US. The pandemic shaped the type and amount of care that was provided: across the country, hospitals ceased or delayed delivery of elective care in preparation for surges. It affected how care was provided: VA quickly expanded the provision of virtual care, and by June 2020, VA was providing 58% of outpatient care virtually (Ferguson, et al., 2021).
The changes in healthcare use during COVID-19 are expected to have an impact on VA cost and utilization data; however, the degree to which the data are affected is unknown. VA employs an activity-based cost accounting system. Some of VA’s costs are fixed (not easily changed in the short run). VA has both fixed direct costs and fixed indirect costs. Fixed direct costs include things like depreciation of equipment and salaries of management positions. According to the Managerial Cost Accounting Office (MCA), fixed indirect costs are “not directly attributable to a specific product. These costs are allocated to direct departments through the indirect cost allocation process. Examples include utilities, maintenance, and overhead costs." These fixed costs are spread across discharges, and despite a change in the number of discharges, fixed costs will remain relatively constant. Therefore, as the number and type of discharges changed in 2020, we expect the cost per discharge to fluctuate as well.
These fluctuations in costs in 2020 will have large implications for researchers trying to understand longitudinal trends in utilization and costs at VA. Therefore, the goal of this report is to understand the effect of the COVID-19 pandemic on cost and utilization data so that VA data users can consider how this affects their particular study. In this analysis, we compare VA inpatient cost and utilization data in Fiscal Year (FY) 2019 to FY 2020.
2. Methods
We compare VA inpatient cost and utilization data for FY 2019 (October 1, 2018 – September 30, 2019) to FY 2020 (October 1, 2019-September 30, 2020). We use HERC’s MCA Discharge Dataset to identify VA cost and utilization. MCA is an activity-based cost allocation system. MCA data is created using a local, activity-based method and is the official managerial cost accounting system for the entire VA. Each VA medical center determines the relative value units of products, the components of encounters, and then uses staff labor mapping and Relative Value Units to assign costs to encounters.
For each fiscal year, we included all complete discharges; we excluded encounters where patients were still in the hospital at the end of the fiscal year. We included all medical surgical and long stay hospitalizations. Costs are presented in nominal dollars.
We calculated mean total cost per discharge, daily cost per discharge, and length of stay per discharge, as well as the mean for components of the total cost: fixed direct cost, fixed indirect cost, and variable direct cost. To understand the impact of the COVID-19 pandemic, we calculated the percent change for each variable between FY 2019 and FY 2020.
We also calculated change in the total number of discharges and cost per discharge by Medicare Severity Diagnosis Related Group (MS-DRG) and Major Diagnostic Category (MDC). We excluded DRGs and MDCs with less than 10 discharges in either year.
3. Results
In FY 2019, VA provided 600,076 inpatient discharges (Table 1). In FY 2020, VA provided 495,529 inpatient discharges, a decrease of 17%. The average cost per discharge increased from $30,282 in FY2019 to $40,763 in FY2020, a 35% increase. Length of stay increased 11%, from 15 days to 16 days.
| Variables | 2019 | 2020 | Percent Change |
|---|---|---|---|
| Number of discharges | 600,076 | 495,529 | -17% |
| Average cost per discharge | $30,282 | $40,763 | 35% |
| Average length of stay | 15 days | 16 days | 11% |
| Average cost per day | $4,279 | $5,433 | 27% |
| Average fixed direct cost per stay | $1,830 | $2,278 | 24% |
| Average fixed indirect cost per stay | $12,532 | $17,536 | 40% |
| Average variable direct cost per stay | $15,920 | $20,949 | 32% |
Tables 2-4 include the change in cost per discharge and number of discharges by DRG. Table 2 presents the DRGs with the largest percent change in cost per discharge from FY 2019 to FY 2020. Table 3 presents the DRGs with the largest percent change in number of discharges from FY 2019 to FY 2020. The DRG for “Respiratory infections and inflammations with MCC,” one of the DRGs associated with a principal diagnosis of COVID-19, saw the greatest percent change, increasing by 229%. However, the increase in discharges seen in Table 3, largely for COVID-19-related DRGs, are not representative of the overall patterns of inpatient utilization and costs. Table 4, which presents the change in cost per discharge and number of discharges for the 10 most common DRGs in 2019, shows that the cost increase is fairly consistent for the most common DRGs. Figure 1 presents the percent change in cost per discharge and number of discharges by MDC for the 15 most common MDCs. A decreased in discharges and increase in costs in FY 2020 occurred across all MDCs, with the exception of MDC 14 Pregnancy, Childbirth & the Puerperium, which saw a 19% decrease in costs.*
| . | Discharges | Costs | ||||
|---|---|---|---|---|---|---|
| DRG | FY19 | FY20 | % Change | FY19 | FY20 | % Change |
| Headaches w/ MCC (102) | 78 | 43 | -45% | $17,412 | $110,047 | 532% |
| Acute MI, Expired w/ CC (284) | 71 | 68 | -4% | $18,042 | $86,361 | 379% |
| NonTraumatic Stupor & Coma w/ MCC (80) | 27 | 17 | -37% | $51,752 | $228,184 | 341% |
| Other Kidney & Urinary Tract Procedures w/o CC/MCC (675) | 106 | 91 | -14% | $21,780 | $75,267 | 246% |
| Peripheral, Cranial Nerve & Other Nervous System Procedures w/o CC/MCC (42) | 110 | 90 | -18% | $26,312 | $81,069 | 208% |
| . | Discharges | Costs | ||||
|---|---|---|---|---|---|---|
| DRG | FY19 | FY20 | % Change | FY19 | FY20 | % Change |
| Respiratory infections and inflammations with MCC (177) | 2,454 | 8,065 | 229% | $41,411 | $58,825 | 42% |
| Endovascular cardiac valve replacement & supplement procedures w MCC (266) | 65 | 116 | 78% | $89,990 | $125,061 | 39% |
| Respiratory system diagnosis w ventilator support >96 hr (207) | 234 | 404 | 73% | $103,777 | $131,779 | 27% |
| Allogeneic bone marrow transplant (14) | 68 | 20 | -71% | $70,540 | $85,030 | 21% |
| Respiratory infections & inflammations w/o MCC (179) | 441 | 733 | 66% | $18,892 | $25,590 | 35% |
| . | Discharges | Costs | ||||
|---|---|---|---|---|---|---|
| DRG | FY19 | FY20 | % Change | FY19 | FY20 | % Change |
| Alcohol, drug abuse or dependence w/o rehab w/o MCC (897) | 46,628 | 37,442 | -20% | $20,699 | $26,781 | 29% |
| Psychoses (885) | 38,773 | 33,328 | -14% | $33,574 | $45,844 | 37% |
| Septicemia or severe sepsis w/o MV >96 hr w/ MCC (871) | 15,623 | 15,308 | -2% | $39,357 | $54,102 | 37% |
| Neuroses except depressive (882) | 14,029 | 10,234 | -27% | $28,559 | $37,296 | 31% |
| Pulmonary edema and respiratory failure (189) | 12,535 | 10,663 | -15% | $29,158 | $38,558 | 32% |
| Heart failure and shock w/ MCC (291) | 12,067 | 11,624 | -4% | $26,314 | $33,145 | 26% |
| Major hip & knee joint replacement or reattachment of lower extremity w/o MCC (470) | 11,952 | 7,939 | -34% | $28,849 | $35,400 | 23% |
| Alcohol, drug abuse or dependence w/ rehab therapy (895) | 11,288 | 8,010 | -29% | $32,303 | $43,821 | 36% |
| Esophagitis, gastroenteritis, & misc. digestive disorders w/o MCC (392) | 10,178 | 7,802 | -23% | $10,693 | $13,700 | 28% |
| Heart failure & shock w/ CC (292) | 9,789 | 8,018 | -18% | $20,034 | $26,011 | 30% |
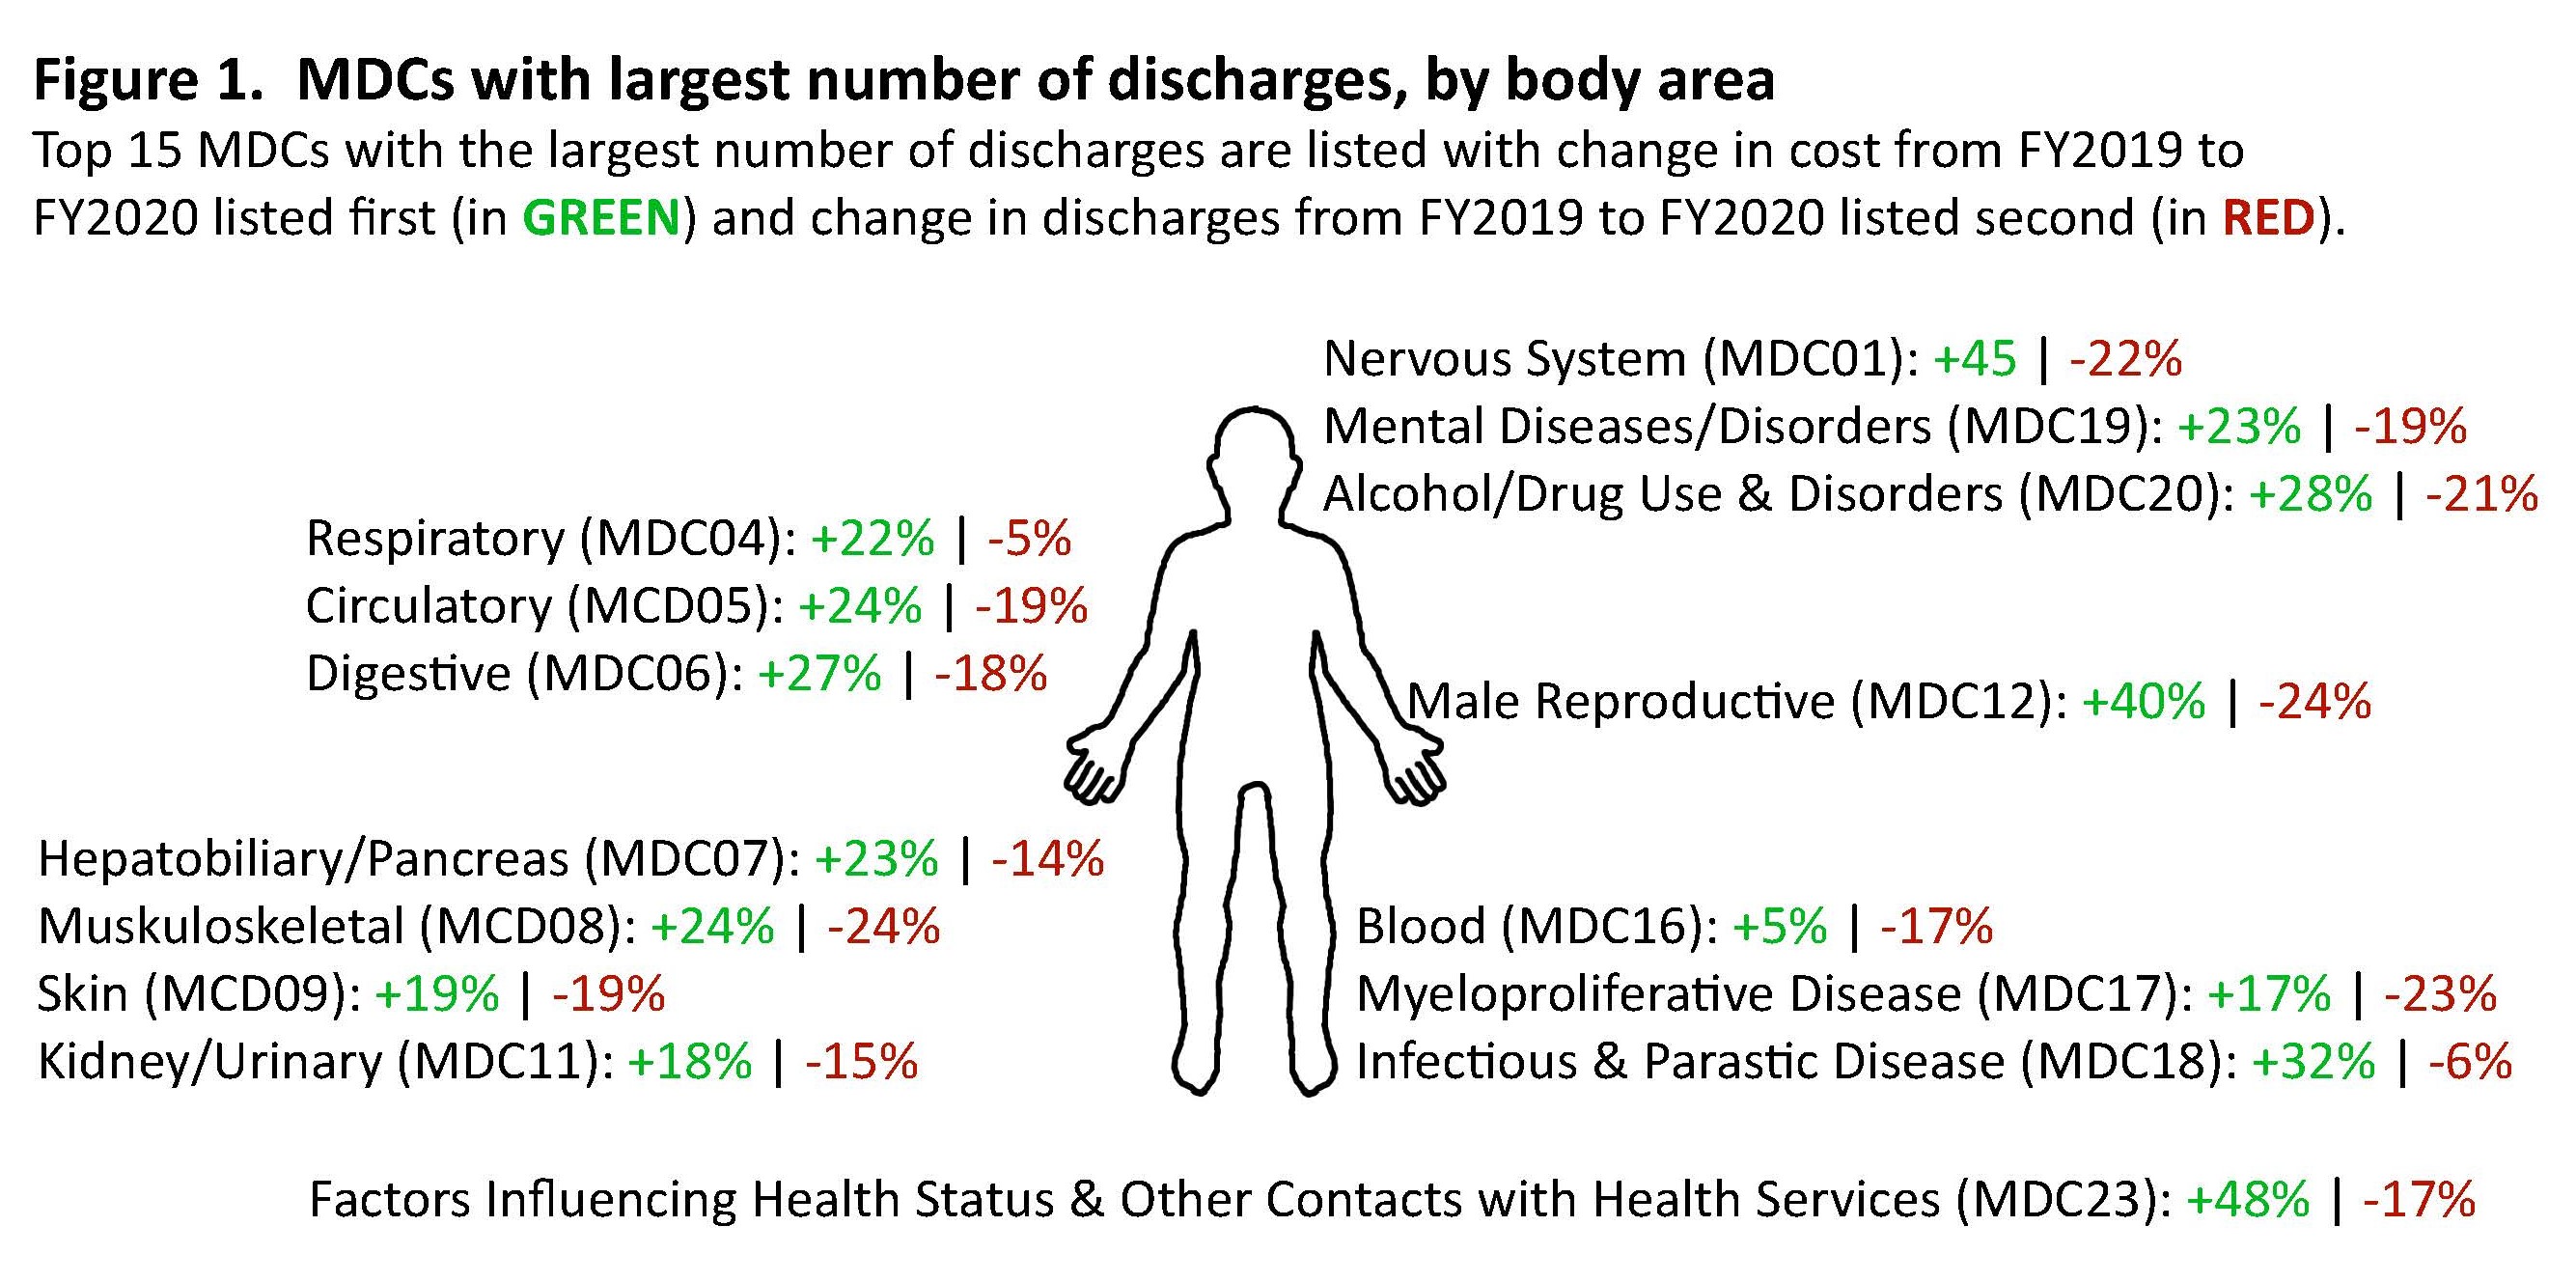
*Although MDC 14 Pregnancy, Childbirth & the Puerperium was the only category to see a decrease in costs, the total number of discharges in FY 2019 and FY 2020 are markedly lower than the other MDCs. MDC 14 had 24 and 11 discharged in FY 2019 and FY 2020, respectively, while, as an example, MDC 05 Circulatory System had 100,537 and 81,850 discharges, respectively.
4. Discussion
From FY2019 to FY2020, the number of discharges decreased 17%. The decrease itself is not surprising. Many people reported avoiding care while sheltering at home as a result of COVID-19. However, maintaining production capacity meant that the costs of labor and capital were spread to the 495,529 discharges. Thus, the average cost per discharge increased dramatically, from $30,282 to $40,763.
This change is not risk adjusted. One might expect healthier patients to postpone elective procedures, when possible. We see that length of stay among admitted patients increased 11% from 15 days to 16 days (this includes medical surgical and long stay hospitalizations). Although this could be due to higher acuity, it could also be due to decreased pressures to discharge patients. If we adjust for length of stay, costs increased 27% between FY2019 and FY2020.
Why did the costs increase so much? VA employs an activity-based cost accounting system, which includes both fixed and variable costs. Between FY2019 and FY2020, fixed direct costs increased 24%, and fixed indirect costs increased 40%.
On the outpatient side, VA was able to quickly shift a majority of care to telehealth (Ferguson, et al., 2021), thereby potentially avoiding the decrease in services seen on the inpatient side. Indeed, preliminary analyses of the FY 2020 HERC outpatient average cost data indicate that care patterns and costs did not change much. However, these data do not reflect any shifts to telehealth; interested researchers can use stop codes to evaluate telehealth use during the pandemic. (For a list of stop codes, see Data FAQs: How do I identify telehealth care in VHA administrative data?) The shifts in care may have long-lasting effects on how care is delivered at VA. HERC and Ci2i researchers, led by Liam Rose, found that as of December 2020, virtual care and community care still made up 67% of VA provided or paid care (Rose, et al., 2021).
The decrease in inpatient utilization and increase in cost per visit during the COVID-19 pandemic have important implications for researchers who use VA data. For example, studies that are conducting patient follow-up should be aware that FY 2020 costs are considerably higher than FY 2019, and this will add variance and reduce their statistical power. Investigators should be aware of these changes and consider how this affects their particular study.
5. References
American Hospital Association. The Effect of COVID-19 on Hospital Financial Health. July 2020. https://www.aha.org/guidesreports/2020-07-20-effect-covid-19-hospital-financial-health.
Centers for Medicare and Medicaid Services. COVID-19 Frequently Asked Questions (FAQs) on Medicare Fee-for-Service (FFS) Billing. May 24, 2021. https://www.cms.gov/files/document/03092020-covid-19-faqs-508.pdf.
Department of Veterans Affairs. Financial Policy. Volume XIII, Chapter 3: Managerial Cost Accounting. December 2019. https://www.va.gov/finance/docs/va-financialpolicyvolumexiiichapter03.pdf.
Department of Veterans Affairs, Veterans Health Administration. About VHA [webpage]. Accessed June 2, 2021. https://www.va.gov/health/aboutvha.asp.
Ferguson JM, Jacobs J, Yefimova M, Greene L, Heyworth L, Zulman DM. Virtual care expansion in the Veterans Health Administration during the COVID-19 pandemic: clinical services and patient characteristics associated with utilization. J Am Med Inform Assoc. 2021;28(3):453-462.
Phibbs CS, Scott WJ, Flores NE, Barnett PG. HERC’s Outpatient Average Cost Datasets for VA Care. Guidebook. Menlo Park, CA. VA Palo Alto, Health Economics Resource Center; June 2019. https://www.herc.research.va.gov/include/page.asp?id=guidebook-outpatient-ac.
Rose L, Tran LD, Asch SM, Vashi A. The COVID-19 pandemic shifted the Veterans Affairs System toward being a payer and virtual care provider: is it sustainable? medRxiv 2021.05.31.21258031. https://doi.org/10.1101/2021.05.31.21258031.


