


Technical Report 34: Updating the HERC Average Cost Method: Updated Coefficients from 2015 Medicare Data
Suggested CitationWagner TH. Updating the HERC Average Cost Method: Updated Coefficients from 2015 Medicare Data. Technical Report 34. Health Economics Resource Center, VA Palo Alto Health Care System, U.S. Department of Veterans Affairs. July 2018.
Disclaimers
Many URLs are not live because they are VA intranet-only. Researchers with VA intranet access can access these sites by copying and pasting the URLs into their browser.
For a list of VA acronyms, please visit the VA acronym checker on the VA intranet at http://vaww.va.gov/Acronyms/fulllist.cfm.
1. Introduction
The HERC Average Cost dataset for inpatient medical/surgical care is created annually by combining Medicare relative value units (RVUs) to estimate U.S. Department of Veterans Affairs (VA) costs for every VA encounter. These methods have been described in detail elsewhere (Wagner, 2003). In 2018, we updated the statistical model using Medicare data from 2015. This technical report describes the updated model.
2. Methods
The VA Information Resource Center (VIReC) works with Medicare to create datasets for veterans who use Medicare. We requested the 2015 Medicare Provider Analysis and Report file (MedPAR). MedPAR exclusively reports payments to facilities (Medicare Part A); we did not attempt to estimate payments to providers, which would involve analyzing Part B claims and linking them to Part A. We focused on hospital claims in the 48 continental United States, dropping records associated with care in Hawaii and Alaska. We excluded long-stay and skilled nursing facility records, focusing our analysis entirely on short stays.
Using the diagnostic related group (DRG) variable, we merged the file to the 2015 Medicare Severity (MS-DRG) weights, which Medicare uses to reimburse hospitals. We also merged the file to the Medicare Cost Report to obtain each facility’s cost-to-charge ratio for 2015. We excluded records that did not merge with a facility cost-to-charge ratio.
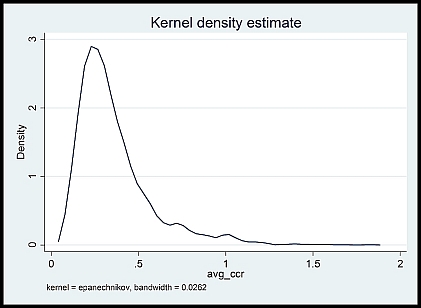
The MedPAR data reports payments and charges; charges frequently exceed payments and many researchers view charges with healthy skepticism (Schwartz, 1995). We focused on charges because we wanted to estimate a relative value unit that was not constrained by the benefit limits imposed by Medicare. We multiplied the reported charges by the cost-to-charge ratio (mean 2.18, median .307, SD 26.47, min .067, max 1400.749), which typically deflates the charges. The very large difference between mean and median is due to the skewness. We excluded records where the cost-to-charge ratio exceeded 2. The resulting cost-to-charge ratio showed a large density around .3 with very few hospitals over 1 (see Figure 1).
Figure 1. Cost to charge ratio
We restricted our choice of independent variables to those from our prior model (Wagner 2003). We included length of stay (LOS) and the calculated the difference between the actual LOS and the expected LOS for a given DRG. To allow for nonlinearities, positive and negative deviations in the actual and expected LOS were allowed to vary independently and in a nonlinear fashion (i.e., squared and cubic terms were included). We also included patient sex, age, whether they died in the hospital, and number of diagnoses.
3. Results
Our ordinary least squares (OLS) regression model with 1996 Medicare data was preferred over semi-log and general linear model, and produced the best fit with an R2 of 0.74. The same model with 2009 data accounted for 76% of the variance with similar results for 2015. Table 1 shows the coefficients for the 2015, along with prior coefficients.
4. Discussion
Using methods based on our earlier work (Wagner, 2003), we developed a cost-regression that yielded an R2 of .76 and shared many similarities with our earlier model. The model performed well with the overall sample (over 1.5 million records). This 2015 MedPAR model is used for predicting medical/surgical costs in the VA starting in FY2017.
Table 1. Regression results from 2015, 2009, and 1996 MedPAR data
| Variables | 2015 MedPAR Coef | 2009 MedPAR Coef | 1996 MedPAR Coef |
|---|---|---|---|
| Died in hospital | 3,236.48 | 3,076.68 | 2,671.21 |
| Sex (female=1, male=0) | -137.60 | -43.65 | 32.91 |
| Age in years | -45.51 | -40.79 | -34.22 |
| Number of diagnoses | 421.53 | 705.00 | 619.04 |
| Number of diagnoses squared | -33.07 | -156.71 | -146.70 |
| Number of diagnoses cubed | 0.88 | 10.58 | 10.98 |
| Length of stay (LOS in days) | -361.87 | -21.67 | 104.26 |
| Positive deviation from DRG-specific average LOS | 1,460.73 | 1,072.46 | 670.95 |
| Negative deviation from DRG-specific average LOS | 1,085.61 | 600.65 | 182.50 |
| NEGLOS squared | -144.05 | -114.80 | -109.89 |
| POSLOS squared | -1.02 | 0.19 | -0.72 |
| NEGLOS cubed | -6.82 | -3.58 | -4.59 |
| POSLOS cubed | 0.00 | 0.00 | 0.00 |
| DRG weight | 7,042.37 | 7,381.10 | 4,860.04 |
| DRG weight squared | -132.49 | -273.52 | -255.16 |
| DRG weight cubed | 6.55 | 9.80 | 12.97 |
| Surgical MDC | 309.77 | -237.30 | 1,069.88 |
| Surgical MDC*LOS | 30.44 | 68.17 | -42.32 |
| Surgical MDC*POSLOS | 664.54 | 534.06 | 421.53 |
| Surgical MDC*NEGLOS | -92.68 | -26.98 | 328.30 |
| Surgical MDC*POSLOS squared | -1.32 | -0.43 | -1.38 |
| Surgical MDC*POSLOS cubed | 0.00 | 0.00 | 0.00 |
| Surgical MDC*NEGLOS squared | -1.47 | 17.70 | 47.50 |
| Surgical MDC*NEGLOS cubed | 3.78 | 2.08 | 3.64 |
| Days in ICU | 366.94 | 491.55 | 593.04 |
| ICU days squared | 14.62 | 6.04 | 10.27 |
| ICU days cubed | -0.02 | -0.00 | -0.03 |
| Constant | 2,472.44 | 760.84 | 413.77 |
5. References
Wagner TH, Chen S, Barnett PG. Using average cost methods to estimate encounter-level costs for medical-surgical stays in the VA. Med Care Res Rev. Sep 2003;60(3 Suppl):15S-36S.
Schwartz M, Young DW, Siegrist R. The ratio of costs to charges: how good a basis for estimating costs? Inquiry. 1995;32(4):476-481.


