


Decision Analysis: Decision trees, Simulation Models, Sensitivity Analyses
Decision analysis is a formal and quantitative method of evaluating resource allocation problems. It can be applied in many fields, including environmental economics, public policy, and healthcare. In healthcare, decision analysis is best suited for situations in which one must choose amongst two or more options and there are meaningful tradeoffs between these alternative strategies or interventions. Decision analysis is used to evaluate the risks and benefits of each strategy relative to the next, and can incorporate any uncertainty about these risks and benefits.
There are multiple types of decision analyses; the most common being:
- cost-effectiveness analysis
- cost-benefit analysis
- budget impact analysis
Cost-effectiveness analysis (CEA) evaluates the costs and health effects of two or more strategies. Health effects can be measured in mutlple ways, but one common way of evaluating health effects in a CEA is a Quality-Adjusted Life Year, or QALY. A cost-benefit analysis (CBA) also evaluates the costs and health effects of two or more strategies, but it assigns a dollar value to the health effects before presenting results. It can be difficult to assign a dollar value to health effects; for this reason, cost-benefit analysis is less commonly seen in healthcare. A budget impact analysis (BIA) estimates the incremental financial consequences of adopting a new intervention, and is usually conducted in addition to a cost-effectiveness analysis. Cost-effectiveness analysis or cost-benefit analysis can elucidate whether a new healthcare strategy provides value (that is, whether health outcomes are proportional to costs), while a budget impact analysis can evaluate whether a high-value strategy is affordable.
Decision analyses can be operationalized through decision trees or through simulation models. Simulation models can take the form of state-transition models or discrete event simulation models. Regardless of their structural form, there are certain similarities across all healthcare decision analyses. First, all decision analyses require specifying the clinical- and policy-relevant features of the problem, the time frame of the analysis, and the relevant patient population. Second, they all require information on the probability of experiencing a health state or a health event. In decision analysis, these are called "transition probabilities." Third, all healthcare decision analyses require information about the payoff(s) associated with a health state or health event. The payoff(s) could be the cost, the health effect, or both. Fourth, due to limitations of data availability, almost all healthcare decision analyses use inputs from multiple studies (e.g., results from one study evaluating the efficacy of an intervention and estimates of the costs of treating the disease from another study, etc.).
Decision trees
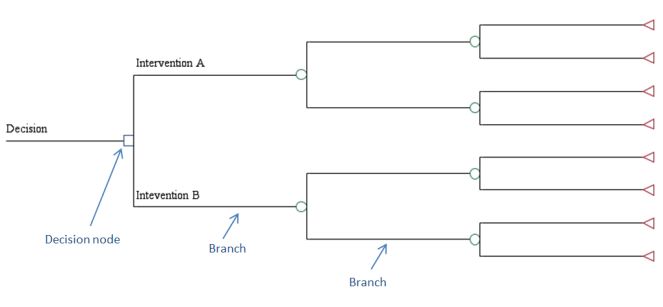
Decision trees are schematic representations of the question of interest and the possible consequences that occur from following each strategy. In the figure below, there are two strategies being considered, as denoted from the two branches emanating from the decision node. Each branch in a decision tree represents a particular health state at a particular point in time. If one is modeling patients over a long period of time, the number of branches in a decision tree can quickly become unwieldy. It is for this reason that many researchers choose a simulation modeling approach.
Decision Tree Example
Simulation Models
As noted above, there are two large categories of models: state-transition models and discrete event simulation models. A state-transition model progresses according to a fixed time interval, called a model cycle. That is, persons transition from one health state to another health state (or stay in the same health state) every model cycle. The modeler chooses the length of the model cycle (called the model cycle length) based on the clinical nature of the disease being modeled, ensuring the length of the model cycle will not allow more than one health state transition to occur. For example, a patient may have the potential to move from uncontrolled diabetes to controlled diabetes every month. Conversely, a discrete event simulation model progresses according to health events, which can happen at various times. For example, in a discrete event simulation looking at the event of myocardial infarction, person A may experience myocardial infarction 6 months after the start of the model, while person B experiences myocardial infarction 13 months after the start of the model. Simulation models are particularly useful when a health state or a health event can occur more than once or when the timing of events is important.
State-transition models
State-transition models describe the transitions patients make among different health states across model cycles. The sum of the model cycles is the time horizon. For example, if persons entered the model at age 65, were followed until age 85 and could experience a transition to another health state annually, the time horizon of the model would be 20 years, with a 1 year cycle length. A state-transition model can be used to model a cohort of patients, in which case it is called a Markov cohort model. A state-transition model can also be used to model individuals; in this case it is called a microsimulation model. A Markov cohort model is "memoryless," while a microsimulation model is not subject to this limitation. "Memoryless" is a defining feature of a Markov model, and indicates that the transition probabilities do not depend on history. Said differently, the likelihood of experiencing a health state depends only on the current state and not on the events that preceded the current state or on the amount of time spent in the current state. This can be a limitation in modeling health states, which often are not independent of the length of time spent in a previous health state. Regardless of whether it is a Markov cohort model or a microsimulation, in a state-transition model, health states are mutually exclusive and collectively exhaustive; an individual must be in one and only one state during each model cycle.
A Markov cohort model can use a Markov process or a Markov chain. In a Markov chain model, the probability of an event remains constant over time. In the example above, the probability of moving from uncontrolled diabetes to controlled diabetes would be the same across all model cycles, even as the cohort ages. In a Markov process model, the probability of an event can change over time. For example, a Markov process model may assign a lower probability of moving from uncontrolled diabetes to controlled diabetes as the cohort ages.
Discrete event simulation models
Discrete event simulation models were first used in industrial engineering and operations research. They are most useful when: 1) when one is evaluating a problem that involves constrained resources (e.g., modeling throughput in an emergency department); or 2) when there are interactions between individuals (e.g., transmission of infectious disease) or interactions between individuals and their environment (e.g., the emergency department becomes crowded on nights and weekends due to the unavailability of urgent care). In a discrete event simulation, events must be mutually exclusive. Individuals progress through the model only if they experience a new event (e.g., moving from the ED waiting room to an ED exam room).
Sensitivity Analyses
Regardless of the way in which one operationalizes a decision analysis (decision tree, state-transition Markov cohort model, state-transition microsimulation, discrete-event simulation), it will be imperative to conduct sensitivity analyses to assess the robustness of model results. This is particularly important, as model inputs are point estimates -- often the mean value of the summary statistic reported in the literature -- and have some uncertainty. The point of a sensitivity analysis is to understand how sensitive model results are to uncertainty in input parameters. There are two main types of sensitivity analyses: deterministic and probabilistic. In a deterministic sensitivity analysis, model inputs are specified as multiple point estimates and varied manually. In a probabilistic sensitivity analysis, model inputs are specified as distributions; in each iteration, a different value is plucked from this distribution (based on its frequency of occurrence) and used as the model input. The model is run for multiple iterations and results for each iteration are plotted in an acceptability curve or a quadrant graph.
Learn More
Research Guidelines
U.S. Public Health Service Guidelines
The U.S. Public Health Service Task Force created guidelines for cost-effectiveness analysis, which were updated in Fall 2016 by the Second Panel on Cost-Effectiveness. This book is an essential reference for any researcher wanting to conduct a cost-effectiveness analysis. Neumann PJ, Sanders GD, Russell LB, Siegel JE and Ganiats TG. Cost-Effectiveness in Health and Medicine: Second Edition. New York: Oxford University Press: 2016.
The Second Panel has a reporting checklist for cost-effectiveness analyses that can be found here: https://jamanetwork.com/journals/jama/fullarticle/2552214
The original 1996 guidelines may also be useful for some readers, although we caution that some of these recommendations have been modified in the Second Panel's textbook.
Gold, M. R., J. E. Siegel, L. B. Russell, M. C. Weinstein. Cost-effectiveness in Health and Medicine. New York: Oxford University Press, 1996.
Consolidated Health Economic Evaluation Reporting Standards (CHEERS) statement
Representatives from academia, clinical practice, industry, government, and the editorial community developed recommendations and a 24-item checklist to follow when reporting economic evaluations of health interventions. A copy of the statement, accompanying checklist, and this report can be found on the ISPOR Consolidated Health Economic Evaluation Reporting Standards (CHEERS) webpage.
Additional Resources
Seminar Series
HERC teaches a cost-effectiveness analysis seminar series designed to teach researchers how to operationalize their own decision analysis.. Archived seminars are available online.
Journal Articles
The following articles are listed in order of increasing complexity. Any researcher undertaking a cost-effectiveness is recommended to read all of these articles.
- Detsky AS, et al. Primer on medical decision analysis: Part 1--Getting started. Med Decis Making. 1997 Apr-Jun; 17(2): 123-125.
- Detsky AS, et al. Primer on medical decision analysis: Part 2--Building a tree. Med Decis Making. 1997 Apr-Jun; 17(2): 126-135.
- Naglie G, et al. Primer on medical decision analysis: Part 3--Estimating probabilities and utilities. Med Decis Making. 1997 Apr-Jun; 17(2): 136-141.
- Krahn, MD, et al. Primer on medical decision analysis: Part 4--Analyzing the model and interpreting results. Med Decis Making. 1997 Apr-Jun; 17(2): 142-151.
- Naimark D, et al. Primer on medical decision analysis: Part 5--Working with Markov processes. Med Decis Making. 1997 Apr-Jun; 17(2): 152-159.
- Beck J, Pauker S. The Markov Process in Medical Prognosis. Med Decis Making. 1983; 3(4): 419-458.
- Siebert U, et al. State-Transition Modeling: A Report of the ISPOR-SMDM Modeling Good Research Practices Task Force-3. Value Health. 2012; 15: 812-820.
- Karnon J, et al. Modeling using Discrete Event Simulation: Modeling Good Research Practices Task Force-4.Value Health. 2012; 15: 821-827.
Textbooks
- Muennig P. Designing and Conducting Cost-Effectiveness Analyses in Medicine and Health Care. San Francisco, CA: Jossey-Bass; 2002.
- Hunink M, Glasziou P, et al. Decision making in health and medicine: Integrating evidence and values. Cambridge, UK: Cambridge University Press; 2001.
- Briggs A, Claxton K, Sculpher M. Decision Modelling for Health Economic Evaluation. Oxford, UK: Oxford University Press; 2006.
Web Resources
- Society for Medical Decision Making
- International Society for Pharmacoeconomics and Outcomes Research
- University of York Centre for Health Economics
Software
Last updated: April 17, 2024


