


Looking for the QUERI Cost-Effectiveness Analysis Guidelines?
What is cost-effectiveness analysis?
Cost-effectiveness analysis is a tool used to aid decisions about which medical care should be offered. It is a method of comparing the cost and effectiveness of two or more alternatives. Such comparisons are useful when one of the alternatives being considered is standard care, as this allows the decision maker to consider whether an innovation is better than the status quo.
The goal of cost-effectiveness analysis to determine if the value of an intervention justifies its cost. Cost-effectiveness involves more than determining cost, it also involves assignment of a value to the outcome.
To facilitate the comparison of different interventions, a standard method of cost-effectiveness analysis was developed by a task force of experts organized by the U.S. Public Health Service (PHS) (Gold, Siegel, Russell, & Weinstein, 1996) and updated in 2016 (Neuman et al., 2016).
Below are the updated PHS Task Force recommendations:
► Costs should be estimated from two reference case perspectives: the health care sector perspective and society's perspective. In analyses from the societal perspective the effects of an intervention on all costs should be considered, including the effect on healthcare expenditures, costs incurred by patients and unpaid caregivers, and other costs and effects outside the health care sector. An “impact inventory” that lists the health and non-health effects of an intervention is recommended for the societal reference case.
► Costs and benefits should be discounted at a 3% annual rate, to reflect the lower economic value of an expense that is delayed and the higher value of a benefit that is realized sooner.
► When the effect of the intervention on costs and benefits is not fully realized during the study period, modeling should be used to estimate the costs and benefits over the patient's lifetime.
► The task force also described methods of estimating the statistical significance of cost-effectiveness findings. Note that when cost-effectiveness is a primary study hypothesis, variance in costs and outcomes, along with their covariance, will affect the sample size.
Cost-effectiveness analysis is not uniformly applied in the healthcare system. Decision makers often adopt new treatments without knowing if they are cost-effective. Even when cost-effectiveness has been studied, decision makers may not be able to interpret the data, or they may not agree with the results. Despite this limitation, cost-effectiveness is increasingly used to inform healthcare decision makers.
A description of the major changes made by the second PHS task force is found in the HERC Bulletin article, "Major Changes to CEA Guidelines" (available upon request), as well as this open access JAMA article by task force members (Sanders et al., 2016). For an overview of the 2016 PHS Task Force recommendations, please also see the HERC cyber seminar "Recommendations for the Conduct of Cost-Effectiveness Analysis from the Second Panel on Cost-Effectiveness Analysis in Health and Medicine" by Douglas Owens, MD, MS on January 26, 2022.
Cost-Effectiveness Studies of Two Interventions
When the choice is between an innovation and standard care, the analyst first applies the principle of strong dominance. Either the innovation or standard care may be preferred using this principal. Strong dominance favors a strategy that is both more effective and less costly. Strong dominance occurs only when the innovation is very good (it works better and saves cost) or very bad (its works worse and costs more).
When the more effective innovation is more costly, strong dominance provides no guidance. The decision maker must decide if the greater effectiveness justifies the cost of achieving it.
It is for this reason that the PHS Task Force recommended that cost-effectiveness studies use the Quality-Adjusted Life Year (QALY) as the outcome measure. The QALY reflects both the quantity and the quality of life (Torrance & Feeny, 1989). It is the most widespread method of measuring the value of providing a healthcare intervention.
Quality of life adjustments are based on patient or societal ratings of the quality of life associated with different health states. The ratings, also known as "preferences" or "utilities," are on a scale of zero (representing death) to one (representing perfect health). There are several methods for obtaining these ratings. The Time-Trade-Off method asks the individual doing the rating how much healthy life they are willing to give up to be cured of the condition. The Standard Gamble method asks them how much of a risk of death they are willing to incur in order to be cured of the condition. The Health Utilities Index (HUI) and EuroQoL are two commonly used instruments used to gather information on quality of life. Methods for assessing economic quality of life are found in the HERC guidebook, Preference Measurement in Economic Analysis, as well as in the HERC cyber seminar entitled, "Introduction to Effectiveness, Patient Preferences, and Utilities" from January 24, 2024, and on the "Measuring Health Preference" page.
When the more effective innovation is also the more costly, the decision maker must decide if the greater effectiveness justifies the cost of achieving it. This is done by calculating an incremental cost-effectiveness ratio, or ICER. The incremental cost-effectiveness ratio is the difference in costs divided by the difference in outcomes. The ratio is the most useful when outcomes are expressed in QALYs because the QALY is an outcome that can be compared across different types of interventions.
The cost-effectiveness ratio represents a measure of how efficiently the proposed intervention can produce an additional QALY. By using this standard method, the cost-effectiveness of alternative innovations may be compared, helping healthcare payers decide what changes they should adopt. The goal of the decision maker is to adopt all interventions that represent efficient ways of producing QALYs and to disapprove of interventions with ratios that are too high.
The PHS Task Force did not recommend a standard of what constitutes a cost-effective intervention (i.e. how low the cost-effectiveness ratio must be for an intervention to be adopted), beyond recommending that a range of thresholds be considered. When outcomes are measured in QALY's, the ratio may be compared to the ratios of other innovations (if standard methods have been employed). Knowledge of the incremental cost-effectiveness of interventions that have been approved can be helpful. Historically, it has been observed that the U.S. healthcare system adopts treatments that cost less than $50,000 per quality-adjusted life year (Owens, 1998). The $50,000 threshold is the most commonly cited cost-per-QALY threshold in U.S. cost-effectiveness studies, though increasingly researchers are referencing a $100,000 threshold (Neumann et al., 2014). The criteria for judging cost-effectiveness are different in different healthcare systems and in different countries. Cameron, Ubels, and Norström (2018) describes some prominent approaches to setting cost-effectiveness thresholds across different countries.
Comparison of Multiple Interventions
In some studies that compare multiple mutually exclusive interventions, an additional dominance principle is applied (Kamlet, 1992). As in the case when comparing two interventions, the analyst first applies the principle of strong dominance. Any of the competing interventions is ruled out if there is another intervention that is both more effective and less costly.
The analyst may then apply the principle of extended dominance (sometimes called "weak dominance"). The list of interventions, trimmed of strongly dominated alternatives, is ordered by effectiveness. Each intervention is compared to the next most effective alternative by calculating the incremental cost-effectiveness ratio. Extended dominance rules out any intervention that has an incremental cost-effectiveness ratio that is greater than that of a more effective intervention. The decision maker prefers the more effective intervention with a lower incremental cost-effectiveness ratio. By approving the more effective interventions, QALY's can be purchased more efficiently. This is made clear by the following example.
Example of Method for Multiple Interventions
Here is a hypothetical example of a comparison of multiple mutually exclusive interventions. The table gives cost in dollars and outcomes in QALY's for standard care and 5 innovations. In the first table, we can rule out intervention A. It is strongly dominated by intervention B, which costs less and yields better outcomes.
| Intervention | Cost | Effectiveness |
|---|---|---|
| E | $55,000 | 5 |
| D | $35,000 | 4 |
| C | $25,000 | 3 |
| B | $10,000 | 2 |
| A | $12,000 | 1.5 |
| Standard Care | $5,000 | 1 |
Next we apply the principle of extended-dominance. Interventions are listed in the order of effectiveness. The incremental cost-effectiveness ratio of each intervention is found by comparing it to the next most effective intervention.
| Intervention | Cost | Effectiveness | Incremental Cost-Effectiveness Ratio |
|---|---|---|---|
| E | $55,000 | 5 | 20,000 |
| D | $35,000 | 4 | 10,000 |
| C | $25,000 | 3 | 15,000 |
| B | $10,000 | 2 | 5,000 |
| Standard Care | $10,000 | 1 | _ |
We can use extended dominance to rule out intervention C. It has an incremental cost-effectiveness ratio of $15,000 per QALY. In order to adopt C, the decision maker must have decided to adopt interventions with a cost-effectiveness ratio of $15,000 per QALY. If this is the case, then the decision maker would prefer intervention D. A greater number of QALY's may be obtained at a lower cost per QALY.
The final table indicates the interventions and their cost-effectiveness ratios after the dominance principles have been applied. It is now up to the decision maker to choose among the interventions by deciding how much a QALY is worth. If a QALY is not worth even $5,000 to the decision maker, then none of the innovations generate sufficient value to be adopted; if a QALY is worth more than $20,000 to the decision maker, then intervention E would be adopted.
| Intervention | Cost | Effectiveness | Incremental Cost-Effectiveness |
|---|---|---|---|
| E | $55,000 | 5 | 20,000 |
| D | $35,000 | 4 | 12,500 |
| B | $10,000 | 2 | 5,000 |
| Standard Care | $5,000 | 1 | _ |
Dominance principles can be also applied by ranking interventions in the order of their cost. The same finding will result. Dominance principles can be applied when outcomes are measured in units other than QALY's. This requires the assumption that measures reflect the most important effect of the treatment on health. For example, if a drug prevents death, and the side effects are known to be minor, outcomes could be measured in terms of life years of survival.
QALY's are the preferred measure of the outcomes, because they have the potential to allow the analysis to trade off mortality with quality of life, including treatment benefits and the side effects.
How do I Evaluate the Uncertainty of an Incremental Cost-Effectiveness Ratio?
Here, we will define an incremental cost-effectiveness ratio (ICER), discuss how to evaluate statistical uncertainty, and present resources for finding the variation in the ICER using SAS.
Definition of the incremental cost-effectiveness ratio
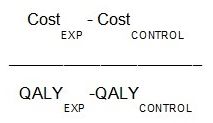
The incremental cost-effectiveness ratio is a way of investigating whether an intervention yields sufficient value to justify its cost. We compare the treated group to the control group, and find the difference in average cost, and differences in average effectiveness. Their ratio is the incremental cost-effectiveness ratio (ICER). The recommended measure for effectiveness is the Quality Adjusted Life Year (QALY), which reflects quality and quantity of life.
The ICER can be computed analytically. The ICER can then be placed inside a 2x2 plot. Consider the following plot of the incremental effect of the intervention on cost (Y axis) and its incremental effect on effectiveness (on the X axis).
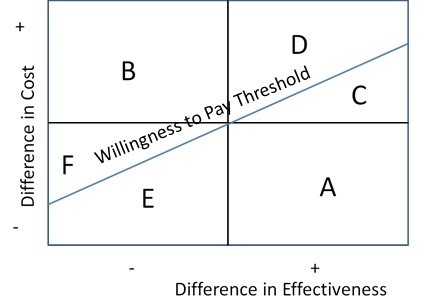
If the ICER falls in cell A, then the intervention dominates the control because it is more effective and less costly. Similarly, if the ICER falls in cell B, the intervention is dominated by the control because it is less effective and more costly.
For the upper right and lower left quadrants, we can determine if a point is cost-effective only if we have a willingness to pay threshold. In the U.S. thresholds of $50,000/QALY or $100,000/QALY are often used.
At points C and D, the intervention is more costly and more effective, but only point C is cost-effective. This is because the cost per unit increase in effectiveness is less than the willingness to pay threshold. Point D is not cost-effective, because it is too costly per unit gain in effectiveness.
At points E and F, the intervention is less costly and less effective. Only point E is cost-effective because the reduction in costs per unit reduction in effectiveness is sufficiently high. In other words, the resources saved by the study intervention are more than the societal accepted level (the willingness to pay) per unit decrease in effectiveness.
Statistical uncertainty of the ICER
Computing the ICER is easy, but it would be incorrect to justify the cost-effectiveness based on one data point without uncertainty. This would be akin to reporting an odds ratio without a confidence interval. Unfortunately, such practice is not uncommon (Houlind, et al. 2013), but it can be misleading. One must present the ICER with the statistical uncertainty.
The ICER cannot be represented by a 95% confidence interval. Each value of the ICER represents two points in the plot of cost vs. effectiveness. For example, an ICER of $100,000 results if the intervention costs $100,000 and yields 1 QALY, and if the intervention saves $100,000 at a loss of 1 QALY. The statistical uncertainty for an ICER must be regarded as a point in a confidence ellipsoid plotted in two-dimensional space, with cost plotted on the Y axis and effectiveness plotted on the X axis.
We can find the variation in the ICER by randomly sampling the source dataset. We find a large number of points that can be plotted in the two-dimensional space and evaluate the distribution of points over the region. In clinical trials, we can use bootstrap sampling to find these points. For medical decision models, probabilistic sensitivity analysis generates these points.
Bootstrap sampling of the ICER
Bootstrap sampling is a method used in clinical trials to find the variation in the ICER. Gray et al. (2011) provide a detailed overview and instructions of this method including a bootstrapping exercise using Excel. Usov (2013) provides helpful SAS code to conduct bootstrapping as part of a SAS conference proceedings paper on economic evaluation methods in clinical trials.
Identifying Health Care Services that are not Cost-Effective
The Institute of Medicine estimated that $210 billion worth of unnecessary services were provided in the U.S. health care system in 2009 (United States Institute of Medicine, 2013).
The most recent effort to address this problem is being coordinated by the American Board of Internal Medicine Foundation and Consumer Reports. The "Choosing Wisely" initiative originally enlisted 9 medical specialty societies, each of which identified five examples of care that is of uncertain value (Cassel &. Guest, 2012). As of 2024, over 80 medical specialty societies have published more than 600 recommendations regarding overused tests and treatments.
Previous efforts have also identified ineffective and inefficient services. The Institute of Medicine listed ineffective treatments widely used in the U.S. health care system in 2008 (United States Institute of Medicine, 2008). The Rand Corporation developed its own list of inappropriate services, including hospitalization, surgery, and pharmaceutical treatments (Schuster, McGlynn, & Brook, 2005). Researchers from the Network for Excellence in Health Innovation (formerly the New England Healthcare Institute) identified 460 studies published in the peer reviewed literature between 1998 and March of 2006 that identified waste or inefficiency (New England Healthcare Institute, 2008 - https://www.nehi-us.org/publications/56-how-many-more-studies-will-it-take/view). A review of the Tufts Cost-Effectiveness Registry identified low-value services that might be excluded from a value-based insurance coverage (Neumann, Auerbach, Cohen, & Greenberg, 2010). A national panel of health care organizations established national priorities for the U.S. health care system, including a specific list of inappropriate services (National Priorities Partnership, 2008). An American College of Physicians workgroup identified 37 examples of clinical situations in which diagnostic and screening tests do not yield very high-value (Qaseem et al., 2012).
These analyses have documented the presence of inefficiency in the U.S. health care system, but they have some limitations. They represent lists of individual studies, not the synthesis of literature on a topic. As a result, there may be countervailing evidence that a listed service is effective or cost-effective. Not all of these efforts describe the strength of the evidence. It is thus not possible to tell which findings are based on the strongest evidence. There is also a need to rank these services by total cost to set a priority for action.
Efforts to address the problem of existing care that is not cost-effective have been called "disinvestment" or "de-implementation" programs. There have been similar initiatives to Choosing Wisely in over 20 countries (Levinson et al., 2015), including those proposed by Elshaug et al. in Australia (Elshaug et al., 2009) and NICE in the UK (Pearson & Littlejohns, 2007).
Additional Resources
Measuring costs for cost-effectiveness analysis
Preference Measurement: Quality Adjusted Life Years (QALYs) and VR-36/VR-12
References
Cameron, D., Ubels, J., & Norström, F. (2018). On what basis are medical cost-effectiveness thresholds set? Clashing opinions and an absence of data: A systematic review. Global Health Action, 11(1): 14788.
Cassel, C. K., & Guest, J. A. (2012). Choosing wisely: helping physicians and patients make smart decisions about their care. JAMA, 307(17), 1801-1802.
Elshaug, A. G., Moss, J. R., Littlejohns, P., Karnon, J., Merlin, T. L., & Hiller, J. E. (2009). Identifying existing health care services that do not provide value for money. Med J Aust, 190(5), 269-273.
Gold, M.R., Siegel, J.E., Russell, L.B., & Weinstein, M.C. (1996). Cost-effectiveness in health and medicine. New York: Oxford University Press.
Gray AM, Clarke PM, Wolstenholme JL, & Wordsworth S. Applied methods of cost-effectiveness analysis in healthcare. Oxford University Press; 2011.
Houlind K, Kjeldsen BJ, Madsen SN, et al. OPCAB surgery is cost-effective for elderly patients. Scand Cardiovasc J. 2013;47(3):185-192. doi:10.3109/14017431.2013.781672
Kamlet, M.S. A framework for cost-utility analysis of government healthcare programs: Office of Disease Prevention and Health Promotion, Public Health Service, U.S. Department of Health and Human Services; 1992.
Levinson, W., Kallewaard, M., Bhatia, S., Wolfson, D., Shortt, S. & Kerr, E.A. (2015). ‘Choosing Wisely’: a growing international campaign. BMJ Qual Saf, 24: 167-174.
National Priorities Partnership. (2008). National Priorities and Goals: Aligning Our Efforts to Transform America’s Healthcare.
Neumann, P. J., Auerbach, H. R., Cohen, J. T., & Greenberg, D. (2010). Low-value services in value-based insurance design. Am J Manag Care, 16(4), 280-286.
Neumann, P.J., Cohen, J.T., & Weinstein, M.C. (2014). Updating cost-effectiveness – The curious resilience of the $50,000-per-QALY threshold. NEJM, 371: 796-797.
Neumann, P.J., Sanders G.D., Russell, L.B., Siegel, J.E., & Ganiats, T.G. (2016). Cost-effectiveness in health and medicine. 2nd ed. New York, NY: Oxford University Press.
New England Healthcare Institute. (2008). How many studies will it take? A collection of evidence that our health care system can do better.
Owens, D. K. (1998). Interpretation of cost-effectiveness analyses [Editorial]. J Gen Intern Med, 13, 716-717.
Parsonage, M., & Neuburger, H. (1992). Discounting and health benefits. Health Econ, 1:71-76.
Pearson, S., & Littlejohns, P. (2007). Reallocating resources: how should the National Institute for Health and Clinical Excellence guide disinvestment efforts in the National Health Service? J Health Serv Res Policy, 12(3), 160-165.
Qaseem, A., Alguire, P., Dallas, P., Feinberg, L. E., Fitzgerald, F. T., Horwitch, C., et al. (2012). Appropriate use of screening and diagnostic tests to foster high-value, cost-conscious care. Ann Intern Med, 156(2), 147-149.
Sanders, G.D., Neumann, P.J., Basu, A. et al. (2016). Recommendations for conduct, methodological practices, and reporting of cost-effectiveness analyses: Second panel on cost-effectiveness in health and medicine. JAMA, 316(10): 1093-1103
Schuster, M. A., McGlynn, E. A., & Brook, R. H. (2005). How good is the quality of health care in the United States? Milbank Q, 83(4), 843-895.
Torrance, G. W., & Feeny, D. (1989). Utilities and quality-adjusted life years. Int J Technol Assess healthcare, 5(4), 559-75.
United States Institute of Medicine. (2008). Knowing what works in health care: a roadmap for the nation: National Academy Press.
United States Institute of Medicine, Committee on the Learning Health Care System in America: Smith, M., Saunders, R., Stuckhardt, L., McGinnis, J.M, eds. (2013). Best Care at Lower Cost: The Path to Continuously Learning Health Care in America: National Academies Press.
Usov A. (2013). “Economic evaluation in clinical trials. You can do it with SAS.” Pharmaceutical Users Software Exchange 2013. Brussels, Belgium: SAS Institute Inc. Available: https://www.lexjansen.com/phuse/2013/he/HE02.pdf.
Last updated: April 12, 2024


