


Suggested CitationWagner T, Chow A, Su P, Barnett PG. HERC’s Average Cost Datasets for VA Inpatient Care. Health Economics Resource Center, U.S. Department of Veterans Affairs. May 2018. https://www.herc.research.va.gov/include/page.asp?id=guidebook-inpt-ac.
DisclaimersAll tables for the HERC inpatient average cost guidebook are saved in an Excel file. Download the tables here.
Many URLs are not live because they are VA intranet only. Researchers with VA intranet access can access these sites by copying and pasting the URLs into their browser.
For a list of VA acronyms, please visit the VA acronym checker on the VA intranet at http://vaww.va.gov/Acronyms/fulllist.cfm.
1. Introduction
The U.S. Department of Veterans Affairs (VA) provides health care to Veterans at more than 120 inpatient facilities. In 1999, the VA funded the Health Economics Resource Center (HERC) to extend prior methods and estimate costs for all VA encounters.1 Our goal was to develop a set of long-term costs that could be used in cost-effectiveness analysis. We use the term ‘long-term’ in the economic sense that all costs are variable. A companion user guide on the HERC outpatient cost data is also available on our website.
Known as the average cost method, we assume that every health care encounter has the average cost of all encounters that share its same characteristics. To find the cost of rehabilitation, blind rehabilitation, spinal cord injury, psychiatric, substance abuse, intermediate medicine, domiciliary, and psychosocial residential rehabilitation stays, we found the average cost of a day of stay, and multiplied it by length of stay to estimate the cost of care. This makes the assumption that every day of stay has the same cost, that is, that costs are directly proportionate to the length of stay. Hereafter, we refer to this as rehabilitation, mental health or long-term care.
To find the cost of acute medical-surgical hospital care, we built a cost function using relative value units (RVUs) from the non-VA sector. These RVUs were the Diagnosis Related Group (DRG) weights used by the Centers for Medicare and Medicaid Services (CMS) to reimburse U.S. hospitals for the care they provide to Medicare patients. The RVUs reflect the effect of diagnosis on the relative quantity of resources used in a hospital stay. In addition to DRG weights, the cost function included length of stay, demographic and other clinical information. The method we employed makes the following assumptions: (1) that the non-VA relative value units, the Medicare DRG weights, reflect the relative costs of VA hospital stays, and (2) that all stays with the same characteristics have the same cost.
The average cost data are based on care provided in the federal fiscal year, which begins on October 1 and ends on September 30 of the following year. The convention is to refer to a federal fiscal year (FY) by the year it ends, thus FY98 represents the period October 1, 1997 to September 30, 1998.
1.1. FY14 Update
HERC average cost data are now stored on the VA Informatics and Computing Infrastructure (VINCI) and the SAS Grid. See Section 5.3 for more details on the request process.
1.2. FY20 Updates
The COVID-19 pandemic of 2020 had a profound effect on US hospitals, including VA. Across the country, many hospitals ceased to deliver elective care in preparation for surges. In FY19, VA provided 600,076 inpatient discharges (complete discharges). This excludes people still in the hospital at the end of FY19. In FY20, VA provided 495,529 inpatient discharges, a decrease of 17%. The average cost per discharge increased dramatically from $30,282 in FY19 to $40,763 in FY20 (nominal dollars); a 35% increase. Changes in cost and length of stay are reflected in the FY20 HERC inpatient average cost data.
These numbers have important implications for researchers who use VA data. For example, studies that are conducting patient follow-up should be aware that 2020 costs are considerably higher than 2019, and this will add variance and reduce their statistical power. Investigators should be aware of these changes and consider how this affects their particular study.
We also identified changes in substance use disorder and domiciliary care that date back to 2018. In 2018, VA discontinued a range of inpatient treating specialty codes (also known as bedsections) for substance use disorder (SUD) care. Most facilities that provided inpatient SUD care diverted patients to the domiciliary - a unit where patients can live while they get outpatient services. The 2018 policy change affects the HERC inpatient average cost inpatient data. See full details in Section 5.3.5.
When creating the acute care file for the FY20 inpatient average cost data, there was a typo in one of the programs that looked only at admit days on or after October 1, 2097 (admitday>=2097), when it should have been admit days on or after October 1, 1997 (admitday>=1997). This yielded no acute care use in FY20, which is incorrect. We have since corrected the code to the appropriate admit day after October 1, 1997, which yielded 379,292 acute care observations. The FY20 HERC inpatient average cost data at the VA Corporate Data Warehouse (CDW) have been updated as of January 10, 2022.
1.3. FY22 Update
In FY21, Spokane (sta3n 668) became the first VA medical center to begin using the new Cerner Millennium electronic health record (EHR) system. In FY22 we see no inpatient costs for Spokane. For more information on the Cerner Millennium EHR, see the VHA Data Portal page VA Millennium EHR Data (https://vaww.vhadataportal.med.va.gov/Data-Sources/Millennium-EHR) (VA intranet only).
2. Cost and utilization data
We used the Cost Distribution Report (CDR) to create the 1998-2003 HERC average cost datasets. The CDR ceased production in 2004 and since then we have used cost data from the Managerial Costa Accounting (MCA; formerly DSS) National Data Extract (NDE) Treating Specialty File, summarized to departments. Below is a brief discussion of the CDR and MCA NDEs.
2.1. Cost data
2.1.1. Cost Distribution Report
The CDR was routinely prepared by all VA medical centers, and represented an estimate of the costs expended by each VA patient care department. The CDR was created by distributing costs reported in the Financial Management System (FMS) cost centers to the “cost distribution accounts” (CDA) of the CDR. The CDAs reflected patient care departments, such as Medical Intensive Care, or Ambulatory Care, Medicine. We created 11 groups of inpatient care and summarized the CDR into these categories (Table 1).
2.1.2. MCA summary
The CDR ceased production in 2004. For a department-level cost dataset, we chose to create our own from the MCA National Data Extract Treatment Specialty File (TRT). The TRT is an encounter-level dataset organized by treating specialty (identical to the bedsection). By summarizing the TRT into a department level dataset, we ensure that the HERC and MCA NDE’s are based on the same underlying costs. In prior years, HERC and MCA included different costs. Therefore, when researchers compared HERC and MCA costs prior to FY04, the datasets differed in both the underlying costs and the relative value units. Now, with FY04 the underlying costs are the same and the only difference between the datasets is the relative value units.
2.2. Utilization data
VA maintains utilization data in the Patient Treatment Files (PTF). These data do not contain cost, payment or charge data, but they do include patient demographics, length of stay, and the Diagnosis Related Group (DRG). There are three file types of PTF files: observation, extended care and acute care. The observation, extended care and acute care have a main, bedsection, observation and census file. In total, there are 12 files per fiscal year and we use all twelve in generating the average cost data. Information on the files that are used to generate the HERC inpatient average cost data can be found from the VA Information Resource Center (VIReC) at https://vaww.virec.research.va.gov/MedSAS/Documentation.htm (VA intranet only).
2.2.1. PTF Main
This file reports all hospital discharges within the fiscal year. This file contains one record for each hospital discharge. The main file does not use a definition of a hospital stay that is comparable to non-VA hospitals. In the non-VA sector, an acute medical-surgical hospitalization followed by a long-term care stay would be recorded as two different stays. In the PTF Main file, however, this is often recorded as a single stay.
2.2.2. PTF Bedsection
The PTF Bedsection file, like the PTF Main, is a discharge dataset. However, unlike the PTF Main, there is a record for each sequential bedsection. The bedsection is the “treating specialty” assigned to the physician who is responsible for the patient’s care. It roughly corresponds to the location where care is delivered, such as medicine, intensive care, rehabilitation, or long-term care. The Bedsection file provides information on the number of days the patient spent in each bedsection. The PTF Bedsection and Main files have different data elements. We use both files to characterize hospital discharges.
2.2.3. PTF Census files
The PTF Main and Bedsection files include information on all discharges, regardless of when they began. These files do not report on patients occupying beds at the end of the reporting period. To fill this gap, the PTF Census files includes information on patients who are in a VA hospital at the end of the fiscal year.
2.2.4. Acute and Extended Care files
Most stays that start in a nursing home file are included in the extended care file, regardless of the bedsection in which the patients ends up. On the other hand, stays that do not start in the nursing home are usually listed in the acute care files.
2.2.5. Observation Bed files
The Observation Bed file was first created in 1998. If a stay includes an observation bedsection, then the observation portion of the stay is separated from the rest of the stay and included in this file. Most observation bed stays are one-day stays, with the patient being discharged from the hospital.
Observation bedsections were created at the same time as the VA was implementing managerial performance incentives to reduce the number of inpatient days per 1000 treated Veterans. Observation data are not included in this performance measure.
Observation bed stays are very heterogeneous, and they present some difficulty in determining their cost. We decided that all observation stays would be given the daily cost of the marginal cost of a day. To calculate the marginal cost of day, we used a statistical model with Medicare data (see Observation Costing Method).
2.3. Merger of cost and utilization databases
We merged the cost and utilization databases, using the categories described in Table 1. In this process, we exclude some facilities and take facility mergers into account.
2.3.1. Excluded facilities
Prior to merging the cost and utilization data, we excluded the facilities that do not provide patient care. These include records for VA Headquarters (station 101), information services centers, and other VA support facilities. A list of these facilities, and their three-digit facility number, is provided in Table 2.
We felt that central administration may involve activities that are more characteristic of a health care payer, rather than a health care provider. For this reason, we decided not to count these facility's costs as overhead costs that should be distributed to patient care departments.
2.3.2. New facilities and mergers
VA has been emphasizing ambulatory care and improved patient access. Consequently, VA can create new facilities and consolidate others. When one facility merges with another, they both take on a single identification number (see Table 3). If facilities consolidate into a single facility during a fiscal year, we assume the consolidation happened at the start of the fiscal year.
2.4. Definition of category of care
We created “patient care categories,” which represent our best judgment about what constitutes the smallest common denominator between the cost and utilization database. A patient care category represents a group of related cost accounts and their associated utilization.
We defined eleven patient care categories based on earlier work.1 For some categories of care at some medical centers, there were mismatches between cost and utilization data. Most mismatches were handled by assigning the costs and utilization to a similar department, creating a higher level of data aggregation.
2.5. Merger of cost and inpatient utilization data
VA databases report costs and utilization in a federal fiscal year. As mentioned above, we wanted to identify the amount of care provided during the fiscal year. Since hospital stays may span fiscal years, we developed a method to divide hospital utilization between fiscal years.
The denominator for the cost data was the fiscal year, whereas the denominator for the utilization data was discharges. These denominators are not equivalent. We could have ignored this difference. This would have been equivalent to assuming that bed occupancy was constant over the year. However, this assumption would be wrong because we know that there is a trend to shorten length of stay and to reduce hospitalization. And we did not want to assume that the same number of patients is in the hospital at the start and at the end of the fiscal year.
A better way to adjust for the difference in denominators was to use information from the Census files. With the Census files we adjusted the discharge file so that it more closely approximated utilization in the fiscal year.
For the utilization data, we included days spent during the current fiscal year by all patients. For those discharged during the fiscal year, their data came from the PTF, limiting the days to those in the fiscal year. For those patients not discharged by the end of the fiscal year, we obtained these days of stay from the PTF census files. This calculation included “leave” days, that is, days that a patient was absent from a hospital, though not yet discharged. The PTF records leave days, but it does not indicate when they occurred. We assumed that leave days are uniformly distributed throughout the stay.
The finest level of detail for the cost data is at department level; patient-level cost data do not exist. To merge the cost and utilization data, we identified 11 categories of inpatient care (see Table 4). There is an overlap between psychiatry, substance abuse and PRRTP programs (psychosocial residential rehabilitation program), which are less intensive inpatient programs for psychiatry and substance abuse.2 Only approved medical centers can have a PRRTP program.
2.6. Data reconciliation
After merging the cost and utilization data for each medical center, typically there are some discrepancies that need to be reconciled. A discrepancy is when there is utilization in one category but no costs, or vice versa. In general, discrepancies are quite rare and more details are available upon request.
2.7. Daily rate
After reconciling the 11 inpatient categories, we divided total costs by total utilization to find the average cost for each category of care at each medical center; this is used in estimating the local costs. We also calculate the average daily rate for each of the categories for the nation; this is used in estimating the national cost.
3. The cost of rehabilitation, mental health and long-term care
3.1. What are rehabilitation, mental health and long-term care?
Most US hospitals differentiate between short-stay acute medical-surgical and non-medical/surgical hospitalizations. Short-stay acute medical-surgical hospitalizations are generally for acute medicine and surgical treatment. While over 90% of short stay hospitalizations are less than 60 days long, there are rare cases that involve a length of stay up to and over a year. In the VA, about half of the inpatient stays can be categorized as acute medical-surgical defined by their bedsections (see Table 4). The remaining stays include rehabilitation, blind rehabilitation, spinal cord injury, psychiatry, substance abuse, intermediate care, domiciliary, and nursing home. This chapter describes how we estimated the cost for rehabilitation, mental health or long-term care.
Between FY98 and FY00, we case-mix adjusted the nursing home costs. After FY00, nursing home care is based on a per diem cost. More information on the cost of nursing home care is covered elsewhere.3
3.2. Cost methodology for rehabilitation, mental health and long-term care
Determining costs for rehabilitation, mental health and long-term care is straightforward. We multiplied the average daily rate, discussed earlier, by the patient’s length of stay. When we use the local daily rate, the result is the local cost. When we use the national daily rate, the result is the national cost.
3.2.1. Leave and pass days
For stays that began before the beginning of the fiscal year, we found the length of stay during the current fiscal year by finding the number of days between the discharge date and the beginning of the fiscal year. This calculation considered “leave” days, that is, days that the patient was absent from the hospital, though not yet discharged. Leave days are also called Absent Bed Occupant Days and are given the variable name LVB in the PTF. The PTF records leave days in a variable named LVB, but it does not record when they occurred. We assumed that leave days are uniformly distributed throughout the stay.
3.2.2. Local outlier costs
As one might expect, there is more variation in the local daily rates than the national daily rates. This raises the question about the accuracy of the local rate. To help identify inaccurate local costs, we generated a flag if a medical center had a daily rate that was 2 standard deviations from the average of all VA medical centers (for that particular care category). Part of this variation could be explained by wages or high cost procedures. Therefore, the flag variable allows the analyst to check for outliers when using the local cost estimates.
3.2.3. Why local rates at all?
Given that there is more variation in the local rates than the national rates, one may ask why we calculate local rates at all. The answer is that sometimes the variation in the local rates is important. Wages are one factor that affects costs, as they depend on the labor market in different geographic localities. If a researcher is interested in the effect of an intervention on a local medical center or VISN, then the local rates may be more appropriate because they partly reflect the wage differentials and other local differences.
4. The cost of acute medical-surgical hospitalizations
The cost of acute medical-surgical hospital care in VA can be more accurately estimated by incorporating diagnostic information from the administrative record, and avoid the assumption that every day of stay is of equal cost.4 We used an econometric cost function, with parameters estimated from non-VA data, to impute the costs for acute medical-surgical stays in the VA.
This method relies heavily on non-VA relative value weights. These weights, known as DRG weights, are used to pay hospitals for providing care to Medicare patients. Upon discharge, patients are assigned a DRG based on their primary diagnosis. This weighting system is used by CMS to determine Medicare payments to hospitals.
This section presents the cost function that we developed with Medicare data. Given the complexities in this chapter, a flow diagram is provided in Appendix 1 to help readers visualize the process.
4.1. Making an acute medical-surgical inpatient discharge database
VA tracks patients using bedsection codes. Because a patient can get transferred among bedsections multiple times within a single acute medical-surgical hospital stay, keeping track of bedsections provides us with a great amount of detail that is necessary for identifying acute medical-surgical stays.
To use non-VA relative value units, we had to restructure the VA data to use the same definition of acute stays as is found outside VA. Most non-VA databases are organized as discharge databases with each record representing an acute medical-surgical hospital discharge. While the PTF Main is a discharge database, it does not distinguish between acute medical-surgical and non-medical/surgical care. In addition, the PTF Bedsection file is a discharge file but it separates each record into bedsection stays, even if the bedsections are all part of one acute medical-surgical stay. Therefore, we had to make a database of acute medical-surgical discharges using the PTF bedsection file. Table 4 shows the bedsection codes used to identify medicine and surgery.
We then sorted the data by scrambled social security number (SCRSSN), medical center (STA3N), bedsection in day (BSINDAY) and bedsection out day (BSOUTDAY). Acute medical-surgical bedsection stays that were contiguous in time were considered to be part of the same hospitalization. Transfers within acute medical-surgical bedsections, such as from surgery to medicine, were aggregated into a single record. We adopted the rule that if a patient was transferred from an acute medical-surgical bedsection to another acute medical-surgical bedsection that this would be considered part of the same stay. Similarly, if a person was transferred from an acute medical-surgical bedsection to a non-medical/surgical bedsection, we ruled that the acute medical-surgical stay had ended. Transfers from an acute medical-surgical bedsection to a non-medical/surgical bedsection and back to an acute medical-surgical bedsection yielded one non-medical/surgical and two acute medical-surgical stays.
We created a program to accumulate contiguous acute medical-surgical bedsection stays. The program also performs a number of other important functions, such as recalculating length of stay, identifying the highest DRG weight from multiple bedsections, and calculating number of days spent in intensive care (ICU). The SAS code for creating medical/surgical discharges is available upon request.
4.2. Selecting the DRG and the relative value associated with a DRG
VA assigns a DRG to each bedsection segment of the hospital stay, and another DRG to the PTF Main file, representing the DRG for the entire stay. For stays with multiple DRGs, we identified the DRG with the highest DRG weight. We merged the DRG to the DRG weight file that CMS develops each year.
4.3. Length of stay
Length of stay is reported in the PTF Bedsection file. We had to recalculate length of stay according to our definition of acute medical-surgical stay. Consequently, length of stay represents all days the patient spent in contiguous acute medical-surgical care bedsections during the stay.
4.4. Building the cost function
We developed a cost function for estimating the cost of acute medical-surgical care. The cost-function was based on non-VA data, where the hospital stay was the unit of analysis. This regression model uses cost adjusted charges on the left-hand side. On the right-hand side, we include variables such as length of stay, DRG weight, whether the patient died in the hospital, age, gender, and so forth. We save the parameters from the regression model (i.e., the beta coefficients). This vector of coefficients is then used to estimate VA costs. It is important to note that the only way this approach can work is for both datasets to have the exact same right-hand side variables.
4.4.1. Data
We chose to use Medicare data for the cost function. For the FY01 - FY04 cost estimates, we used the 1999 MedPAR file of veterans for estimating costs.5 For FY05-2010, we used the 2003 MedPAR file and for 2011 to present we used the 2009 MedPAR data. A technical report on the cost function with the 2011 MedPAR data is available on the HERC website.
4.4.2. Cost adjusted charges
We used the facility’s cost to charge ratio (CCR) to adjust total charges reported in the MedPAR data. The CCR was linked to the Medicare dataset with the PPS number. The CCR is a hospital-specific adjustment.
4.4.3. The dependent variable
We used cost adjusted charges as our dependent variable when we built the cost function. However, the cost adjusted charges from the Medicare data are not normally distributed.
Because of the skewness, we tried transforming the cost adjusted charges. While the log transformation helped reduce the appearance of skewness, the non-logged function consistently performed better than models with logged cost adjusted charges. Using logs presents additional hurdles because the estimated costs need to be transformed back to the original metric (dollars), adjusting for retransformation bias. The usual adjustment for retransformation bias is the smearing estimator.6 While relatively simple to implement, this adds another layer of complexity to the entire process.
4.4.4. Length of stay
There are different ways to include length of stay in a cost function. One way is to include it without making any transformations, such that length of stay is a positive integer. Variations on this approach were also considered, such as a set of dummy variables representing different lengths of stay.
A second method for including length of stay involves comparing the patient's length to the average length of stay for all patients with that DRG. This second approach requires knowing the average length of stay for each DRG. This information is conveniently provided by CMS with the DRG weight file. We found slight advantages to the second approach as the transformation turned the length of stay from a positive integer into a continuous scale. Having a continuous scale provides slightly more ability to discriminate costs based on deviations in length of stay.
We used the second approach. In addition, we relaxed the constraints of our earlier estimates, allowing the cost of marginal days of stay to vary, depending on the length of stay.
Note that we examined only those records of patients discharged during the fiscal year under study. We included days of stay in acute medical-surgical bedsections, even if they occurred in previous fiscal years, and excluded data from stays that were not complete by the end of the fiscal year. This is distinct from the rest of our method, which considered only the days of stay that occurred during the fiscal year under study. We also calculated the length of stay in ICU bedsections. For each acute medical-surgical hospital stay, we found the number of days spent in the medical and surgical ICU bedsections.
4.4.5. Individual DRG intercepts or DRG weights
We found little marginal value in including dummy variables for each DRG. When we included DRG weight (squared and cubic terms), the gain in R2 was less than 1%. Given the additional complexity in estimating this model, we decide not to use it. Instead, we decided to use DRG weight in our cost function along with the DRG weight squared and cubed. In the final model, we also interacted the Medicine Major Diagnostic Category (MDC) and Surgery MDC with length of stay.
4.4.6. Outliers
Outliers can have undue leverage on a regression model. After we ran the model, we found that the model fit the data reasonably well. However, the fit was based primarily on the high cost users. The model did not fit as well for low-cost users, due in part to heteroskedasticity.
One solution involves removing or “trimming” outliers. We tried this and retested the model fit. Our methods and findings are below. We first identified outliers by using the Medicare outlier designation (n=1880). This did not help the fit of the model with low-cost cases because the outlier designation typically identifies the expensive cases.
Then we empirically identified outliers by generating Cooks' distance. Cooks' distance is the leverage of case i on the OLS regression coefficients. It can be thought of as an F test comparing the beta coefficients with and without observation i. Large values for Cook's distance suggest that the case has a lot of leverage.
We trimmed outliers in our regression models using three exclusion criteria:[a]
- Cooks distance >0.001 (excluded 968 observations, ~0.8%)
- Cooks distance >0.0001 (excluded 2,101 observations, ~1.7%)
- Cooks distance >0.00001 (excluded 8,431 observations, ~6.6%)
We found that we could estimate better fitting models if some outliers were excluded. This gain was mainly within the lowest quartile of costs.
We decided not to remove outliers because we realized any decision about which outliers should be removed would be arbitrary and would affect the model's fit. The full model fits almost as well (and better in some instances), therefore we saw little rationale for removing outliers.
4.5. Observation days
In 1997, VA created codes for bedsections to report inpatient care provided in observation units. Most stays involving these codes are recorded in the observation PTF files, which is a new set of files in the PTF. These stays, even if there are associated with an inpatient record in the Acute PTF file, are kept in a separate observation bed file at Austin. The structure of the observation files mirrors the PTF inpatient files. We found that many stays reported in this file precede or follow stays in the acute medical-surgical PTF file. When calculating length of stay, some analysts will want to regard these observation days as part of acute medical-surgical stays.[b]
For the cost of observation bed stays, for FY98 onward we costed each day at the marginal cost of an additional day (i.e., $684). This method may underestimate the cost of stand-alone observation stays. Alternatively, it may overestimate the cost of an observation stay that preceded a hospitalization. We hope to develop and test new methods for costing observation bed stays in the future.
4.6. Negative or implausible costs
The cost function can impute negative costs because it was not constrained to predict non-negative estimates. Therefore, rare combinations of right-hand-side variables can lead to negative predictions (typically less than .5%). Negative costs were assigned the marginal cost per day of $684.75.
The cost of a marginal day of stay was calculated in a simulation with the 1996 Medicare data. Adjusting for all other covariates in a linear regression, we identified the cost for an additional day of stay. Holding all other factors at their mean, if a person stayed an additional day, they had an additional $684.75 of cost adjusted charges.
While some stays were not assigned negative costs, they were given very low costs. For instance 42 hospital stays had positive costs less than $5. We decided that any stay with a cost less than $684.75 was implausibly low and an artifact of the cost function. By setting this rule, it effectively set a floor on the estimated cost per stay. A total of 9,632 (2%) cases had non-negative costs less than $684.75. These cases were all given $684.75 per day (86% had a length of stay of one day). In the future, we will explore other methods for determining the cost of these cases, including setting constraints on the cost function.
4.7. Reconciling the Costs
The cost function is based on non-VA relative value weights and non-VA cost adjusted charges. The estimated costs must be reconciled to VA costs. We chose to reconcile the estimated costs to the medical center and nationwide. Reconciling the costs to the medical center results in “local” cost estimates, while reconciling the costs for the entire VA, results in “national” cost estimates. Therefore, this process results in the creation of 2 VA cost estimates: a local cost estimate (costl) and a national cost estimate (costn).
The logic behind reconciling the costs is straightforward. For the local cost estimate we sum together the estimated costs for a medical center and divide this amount by the total acute medical-surgical care costs (acute medicine and surgery) for the medical center. The quotient of this division is a scaling factor. By multiplying the estimated cost by this scaling factor, we ensure that the sum of the estimated costs is equivalent to VA costs.
A fiscal year adjustment was also undertaken. MCA report costs for the fiscal year while the acute medical-surgical hospitalization data represent discharges. Each fiscal year, some stays started before the fiscal year and other patients who were hospitalized were still in the hospital at the end of the fiscal year. Due to the declining trend in inpatient hospitalization, a fiscal year adjustment is needed. These adjustments are listed in the Table 5.
5. User's Guide
This chapter discusses how to use HERC’s average cost dataset. The chapter covers five topics: 1) a brief summary of the methods, 2) assumptions underlying the dataset, 3) how to correctly use the dataset, 4) when not to use the dataset, and 5) duplicates. Although we hope that these data will be useful, we do not expect that they will be appropriate for every study. For this reason, later in this chapter we discuss limitations with these data and instances where these data are not appropriate. Appendix 2 includes the contents of the HERC average cost data.
5.1. Summary of methods
5.1.1. Categories of inpatient care
We categorize inpatient care into eleven categories: 0) acute medicine, 1) rehabilitation, 2) blind rehabilitation, 3) spinal cord injury rehabilitation, 4) surgery, 5) psychiatry, 6) substance abuse care, 7) intermediate medicine, 8) domiciliary, 9) nursing home care, and 10) psychosocial residential rehabilitation programs (PRRTP). These categories are defined by bedsection / treating specialty codes (see Table 4). PRRTP care can only be provided at approved medical centers. If a non-approved medical center had dollars or days in PRRTP bedsections, these were allocated back to psychiatry and substance abuse care, respectively.
5.1.2. Acute medical-surgical care
For acute medicine and surgery, we estimated costs using a cost-function from Medicare MedPAR data restricted to Veteran users. To do this, we developed a VA acute medical-surgical dataset using the PTF Bedsection file. Contiguous acute medical-surgical bedsection stays were aggregated into a single record. In the cost function, length of stay was entered into the model as the deviation from the expected length of stay for that DRG. We also used DRG weight as the measure of relative weight, rather than allow each DRG to have its own intercept.
For each observation day in an acute medicine or surgical bedsection, we costed it at the marginal cost per day, which we estimated at $684.75. The cost function yielded some negative and implausible costs. We set $684.75 (the marginal cost of a day), as the minimum cost possible.
Lastly, we reconciled the estimated costs to the medical center’s and overall VA’s costs. This yielded a local cost estimate (costl) and a national cost estimate (costn).
5.1.3. Non medical/surgical categories
Rehabilitation, psychiatry and long term care costs were estimated using a daily rate. For FY98-FY00, nursing home costs are case-mix adjusted. Since FY00, nursing home costs have been based on an unadjusted per diem.
5.2. Assumptions in the average cost dataset
Throughout this document we have tried to identify assumptions underlying the creation of the acute medical-surgical and non medical/surgical datasets. These data include indirect costs and physician costs; excluded are the cost of capital financing and malpractice. Table 6 shows the included and excluded costs.
5.2.1. Data used in the cost function
The average cost estimates for acute medical-surgical stays were based on a cost function that was constructed with Medicare data. The cost function for FY98-FY00 was built using 1996 Medicare data. For FY01 - FY04, we used 1999 Medicare data. For FY05-FY10, we used 2003 Medicare data and for FY11 to present we used the 2009 MedPAR data. The Medicare data represented veteran users; excluded were cases in Hawaii, in Alaska and cases related to labor and delivery. In using the Medicare data we assumed that the underlying accounting systems for non-VA hospitals could be used to impute estimates for the VA. These imputed estimates were then reconciled with the VA costs.
5.2.2. The cost of observation stays
Observation stays are a relatively new type of service provided in the VA. There is no analogous type of service provided in the private sector. To estimate the cost of the observation bed stay, we estimated a marginal daily rate and multiplied this times the length of stay. Most people stay in the observation bed for one day; a few outliers stay longer and in these cases, the cost is equivalent to this rate times the length of stay. To calculate the daily rate for observation bed stays, we developed a regression model using Medicare data. With the regression model, we simulated the marginal cost at the mean of data. We then predicted the cost if the person stayed one day longer than the mean. The difference between these two estimates was $684.75. We used this as the daily rate for the observation bed stays.
5.2.3. Costs for high and low-cost procedures
We used a cost function to estimate acute medical-surgical costs, and this method is more accurate with high-cost cases than low-cost cases. If you are assessing cases that typically have very low costs, then the average cost provided in the HERC dataset may be inappropriate. Our method does not account for very expensive inpatient procedures that are not captured by the DRG or LOS variables.
5.2.4. Implicit trimming of outliers
A byproduct of using a statically-based cost function is that the predicted costs have less variability than the true data—the method removes many of the outliers. Recall that the cost function is a linear regression model. When we calculated the cost for the VA we used the regression model to estimate costs based on averages. If you are interested in high- or low-cost outliers, then the HERC dataset may be inappropriate for your use.
5.2.5. Model estimates and negative costs
Another byproduct of using a cost function is that after we imputed the VA costs we had some cases with negative or implausibly low costs. Clearly, a stay cannot have a negative cost. Therefore, we decided that we would set a floor. Any choice of a floor is somewhat arbitrary, but we chose the floor to be $684.75. Recall that $684.75 is the average cost of an additional day of stay. When you use the HERC Average Cost data, compare the length of stay to the cost. If you believe your data have low cost cases, then you may want to use other values in a sensitivity analysis.
5.2.6. VISN administrative costs
Each of the Veterans Integrated Service Networks (VISNs) incurs administrative operating costs. We have included these costs under the assumption that they cover coordination expenses required for a large health provider. From our perspective, these costs should be distributed to all medical centers in the VISN, and it is not clear that this always happens. This may partly explain discrepancies in local costs, and if your study requires local costs, then use them carefully.
5.3. Using the average cost dataset
The HERC inpatient average cost data are now stored at VINCI and on the SAS Grid. These datasets are listed in Table 7 and described below. Access to HERC inpatient average cost data is governed by the VA National Data Systems (NDS). The most current information on the data request process can be found on the VHA Data Portal at (VA intranet only: http://vaww.vhadataportal.med.va.gov/DataSources/HERCCostData.aspx) under the heading "Access."
Once approved for access, the files can be found in VINCI at VINCI_HERC.HERC and on the SAS Grid at /data/prod/HERC. Please note that data at VINCI are only available behind the firewall so users must have VINCI clearance in order to access the location. The SAS Grid can only be accessed from within a grid connection or from a Secure FTP client application.
For ways to use the three inpatient average cost files (dischg, mdsrg, nmdsrg), see Table 8.
5.3.1. Discharge dataset
Combining the acute and non-acute datasets yielded the discharge dataset. It represents a discharge dataset, and as such it only has cases that were discharged in the FY. In addition, only people admitted since the beginning of FY98 are included in the discharge datasets. Patients that were admitted prior to FY98 are excluded.
The discharge dataset includes additional variables that track cost subtotals, length of stay subtotals, DRG weight, and ICU days. See Table 9 for a list of variables in the discharge dataset. A single discharge record provides important subtotals. For example, if a researcher is interested in mental health costs, he/she can now identify the mental health costs for every inpatient encounter. This is particularly helpful for those patients who receive care in many different categories during a stay. Again, note that these changes only pertain to the inpatient discharge datasets.
5.3.2. Acute medical-surgical dataset
This dataset is best described as a discharge dataset for persons who were discharged or transferred from an acute medical-surgical bedsection in the fiscal year. The key to understanding this dataset is that we aggregated the bedsection files to make a discharge file that is analogous to the MedPAR dataset.
The first step of the process involved identifying acute medical-surgical bedsections. If, during a stay,[c] a person was in three acute medical-surgical bedsections, we combined these bedsections. Transfers within acute medical-surgical bedsections, such as from surgery to medicine, were aggregated into a single record. We adopted the rule that if a patient was transferred from an acute medical-surgical bedsection to another acute medical-surgical bedsection that this would be considered part of the same acute medical-surgical stay. Similarly, if a person was transferred from an acute medical-surgical bedsection to a non-medical/surgical bedsection, we ruled that the acute medical-surgical stay had ended. Transfers from an acute medical-surgical bedsection to a non-medical/surgical bedsection and back to an acute medical-surgical bedsection were treated as one non-medical/surgical and two acute medical-surgical stays.
You will want to link this file to the PTF Bedsection files. But before you merge those files with this cost file, you will need to aggregate the Bedsection file. Please contact HERC if you would like an electronic version of this SAS code.
See Table 10 for a list of variables in the medical/surgical file.
5.3.3. Rehabilitation, mental health or long-term dataset
This dataset contains costs for people who had a non medical-surgical stay. Only costs for stays during the fiscal year are included. If a person was admitted and discharged in FY05, then the total cost of their stay is in the FY05 dataset. However, if a person was admitted in FY04 and discharged in FY05, then only costs for the portion of the stay during FY05 is reported in the FY05 dataset. One of the reasons for doing this is that there are some people in long-term care who have been there for 30+ years. It would be extremely difficult to identify the entire cost of these stays. For information on costs prior to FY98, see HERC Technical Report 1.1 See Table 11 for a list of variables in the rehabilitation, mental health and long-term care dataset.
5.3.4. Flag
An important variable is the flag variable. This variable indicates when the local cost estimate (costl) is > 2 standard deviations above or below the national cost estimate. Flag is an indicator or dummy variable; use the costl with caution when the flag variable is one.
5.3.5. Substance use care and costs
In 2018, VA discontinued a range of inpatient treating specialty codes (also known as bedsections) for substance use disorder (SUD) care. VA left intact one treating specialty code for intensive alcohol treatment and intensive drug treatment. Most facilities that provided inpatient SUD care diverted patients to the domiciliary—a unit where patients can live while they get outpatient services. Because domiciliary care is less expensive than traditional inpatient care, this allowed some VA facilities to expand access.
For example, the Baltimore VA medical center provided 11,662 days of inpatient substance use treatment and 6710 days of domiciliary care in 2018. In 2019, it provided 2 days of intensive inpatient SUD care and 31,458 days of domiciliary care.
The 2018 policy change affects the HERC average cost inpatient data. There was a large increase in average daily costs for patients in intensive SUD treatment: $952 in 2018 to $2,650 in 2019. See the Inpatient Data page for average costs for substance use treatment by year. None of these changes are unexpected, but they could affect studies that are tracking substance use care and costs.
5.4. When not to use the average cost dataset
5.4.1. Effects not detected in this cost estimate
It is not always appropriate to use the Average Cost data in your analysis. The average cost method assigns the same cost to all inpatient stays with the same demographic and discharge information. Stays that have the identical characteristics will have the same cost. If you are interested in assessing the cost consequences of a new procedure, then these data are likely to be inappropriate unless the cost of the procedure is entirely reflected by variables in the cost function. If the procedure saves money, but it does not affect one of the variables in the cost function, such as DRG weight or length of stay, then these stays will all get the average cost.
For example, let us assume that we had a new procedure for transfusing blood during a heart transplant. We are interested in whether this new procedure saves money. First, let us assume that this intervention would not affect the patient's DRG. In this case, it is also likely that the intervention would not affect other variables in the cost function, such as length of stay. Therefore, the estimated cost of care for people who received this new procedure would be the same estimated cost of care for people receiving the usual therapy. This does not mean that there was not a cost difference from this new therapy. It only means that any differences were not reflected in the HERC average cost data.
5.4.2. Comparison of medical center efficiency
The economic definition of efficiency is to use fewer inputs to make the same level of output, or conversely, to use the same number of inputs to make more output. The relative value weights we use DO NOT capture differences in the quantity or price of the inputs. In addition, the CDR costs (FY98-FY03) and MCA costs (FY04+) exclude the cost of capital financing. Finally, we distribute other short-term fixed costs in proportion to the variable costs. Although these issues may not be critical for cost-effectiveness analysis, they may be problematic and potentially fatal for efficiency analysis.
5.4.3. Point estimates versus variance estimates
We believe the average cost method produces relatively accurate point estimates for the costs. However, a consequence of estimating costs with a cost function is that the variance of the estimated costs is biased downwards. The reason for this is that many factors that affect costs are not included in the cost function, and if the stays are identical on all observed factors then these cases receive the same estimated cost. In Table 12 we show the costs reported by Medicare (1996) for five DRGs. We also show the estimated costs from our cost function (estcost). As is clear from this table, the standard deviation is smaller in the estimated costs. Also, the minimum and maximum are attenuated toward the mean.
If you are interested in evaluating the variation of these cost estimates, then use the average cost data carefully. If you use these cost estimates in a statistical model, most statistical tests will be biased toward the null. If you are trying to identify cases on the fringe of the cost distribution (high or low), then you will almost certainly miss some using these data.
5.5. Duplicates
Researchers who want to merge VA utilization data to our average cost estimates need to be aware that the PTF files have duplicates. There are duplicates within each file (e.g., PB discharge file) and between files (e.g., PB discharge file and XB discharge file). We excluded duplicates when we created the average cost datasets, and then we added the duplicate records back into the dataset to ensure the data had the same number of records. These duplicates have missing costs, so they can be easily excluded.
When merging records:
1) Drop HERC records with missing values. This includes duplicate records, community nursing home records and patients admitted prior to FY98.
2) Delete duplicates from the Austin data that you are working with. One way to do this is to run the following command in SAS. Note that these commands only identify records that have duplicate values of the sort variables. The records may differ in other respects.
proc sort data=
by scrssn admitday adtime disday sta3n bsinday bsoutday;
References
1. Barnett PG, Chen S, Wagner TH. Determining the Cost of VA Care with the Average Cost Method for the 1993-1997 Fiscal Years. HERC Technical Report 1. 2000.
2. Wagner TH, Chen S. An economic evaluation of inpatient residential treatment programs in the Department of Veterans Affairs. Med Care Res Rev. 2005;62(2):187-204.
3. Yu W, Wagner TH, Chen S, Barnett PG. Average cost of VA rehabilitation, mental health, and long-term hospital stays. Med Care Res Rev. 2003;60(3 Suppl):40S-53S.
4. Barnett PG. Research without billing data. Econometric estimation of patient-specific costs. Med Care. 1997;35(6):553-563.
5. Wagner TH, Chen S, Barnett PG. Using average cost methods to estimate encounter-level costs for medical-surgical stays in the VA. Med Care Res Rev. 2003;60(3 Suppl):15S-36S.
6. Duan N, Manning Jr W, Morris C, Newhouse J. A Comparison of Alternative Models for the Demand for Medical Care. Journal of Business & Economic Statistics. 1983;1(2):115-126.
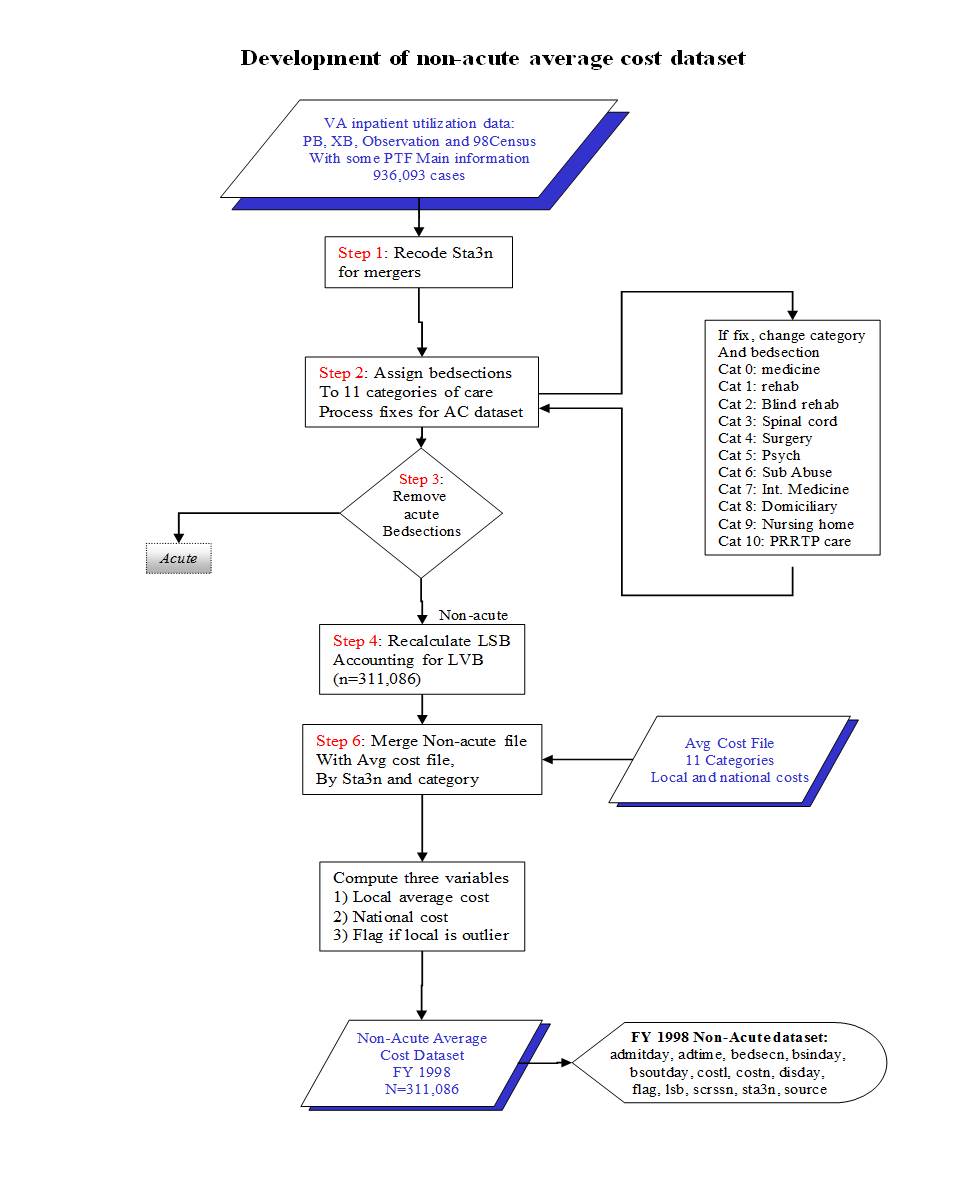
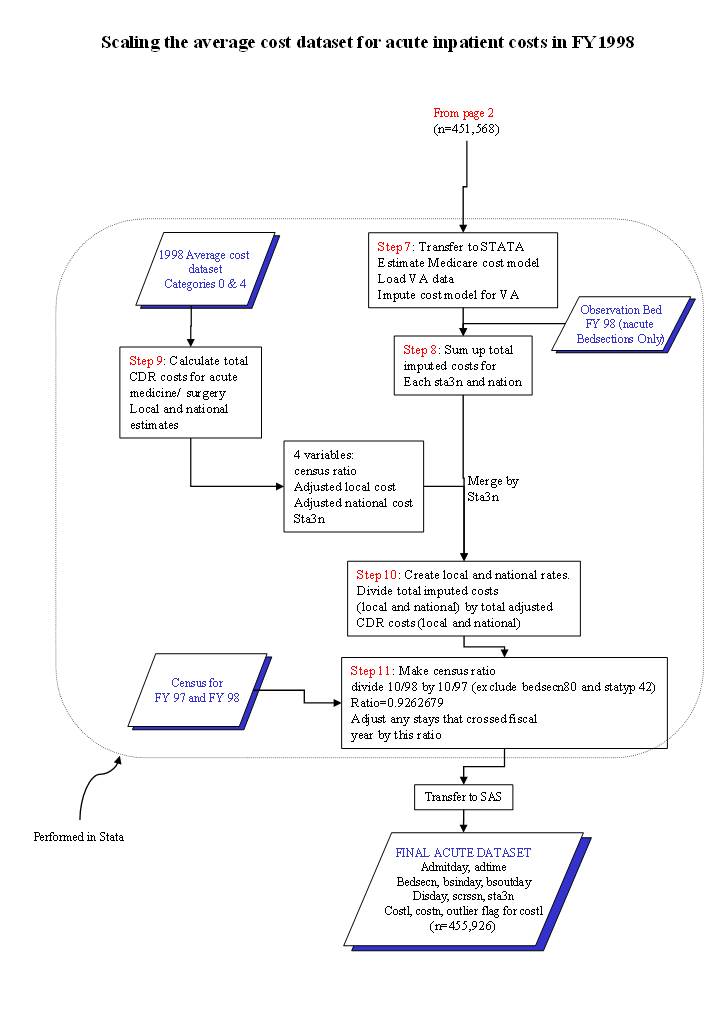
Appendix 1: Flow diagram for inpatient care
Footnotes
[a]We also compared logged CAC models. In every case, the log models fit significantly worse and yielded much larger differences between estimated costs and actual costs.
[b]Nearly 73,000 days of stay were assigned to observation bed sections in FY99 (out of 13.5 million days in VA hospitals). Most observation stays were one day long, but this was not always the case. Most observation days were in medicine, surgery, and psychiatry observation bedsections. We examined the FY99 data and found that 19,428 (26%) of the observation stays immediately preceded a stay reported the PTF bedsection files. Another 319 observations stays followed stays in the bedsection file. (Our analysis was limited to PTF bedsection file. It is also possible that observation stays precede or follow stays reported in the PTF extended care file.)
[c]Stays were defined by five variables: scrssn, sta3n, admitday, adtime, disday.
AcknowledgementsMany programmers have made this work possible including Jeanie Lo, Sam King, Jesse Velez, Matt Yeh, and Shuo Chen. Wei Yu contributed to earlier versions of this work. We would like to acknowledge Douglas Bradham, Ann Hendricks, Denise Hynes, Terri Menke, and Anne Sales. Their insight, experience and advice helped to produce a higher quality product. We would also like to acknowledge Health Systems Research Service (HSR) and the Cooperative Studies Program (CSP) for funding this research.
Last Updated Date: May 25, 2023


